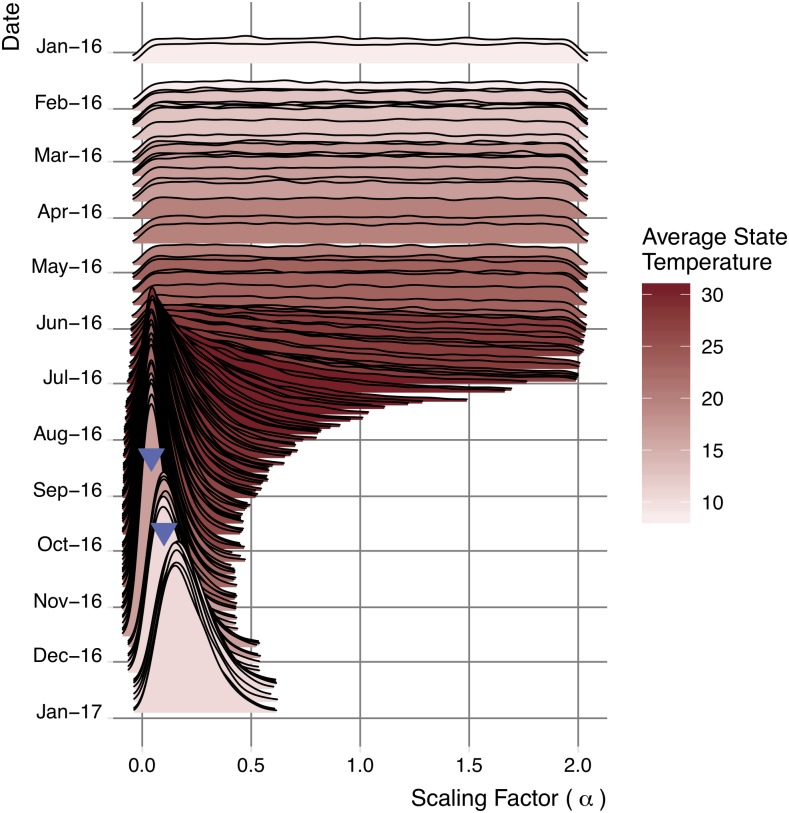
Fig 3. Evolving posterior distribution of statewide scaling factor for R0.
Zika importations, both with and without subsequent detected autochthonous transmission, provide insight into local transmission potential, via a statewide scaling factor, α. This shows the posterior distributions of α, for each day of 2016 that had at least one imported case. Median estimates reach a minimum in early November, just before the detected autochthonous transmission events (upside-down blue triangles). Red shading indicates the average statewide monthly temperature. Note: the scaling factor is never less than zero.

