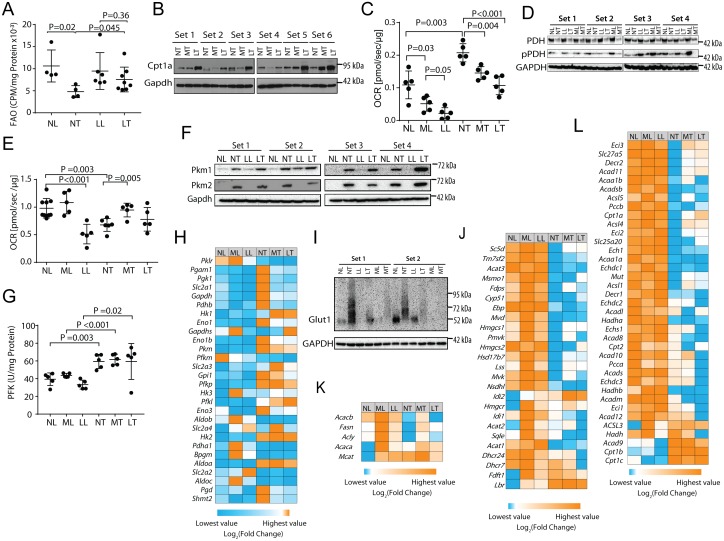
Fig 2. HFDs force metabolic re-programming.
A, FAO by isolated mitochondria. Mitochondria from the indicated tissues were incubated with 3H-palmitate-BSA and the release of water-soluble products was quantified. B, Cpt1a immuno-blots showing increased expression of Cpt1a in tumors from mice maintained on LC-HFDs but not on MC-HFDs (P = 0.025). C, PDH activities. OCRs were quantified following the addition of malate, ADP and pyruvate to isolated mitochondria. D, PDH and pPDH immuno-blots. No significant differences among the different tumor groups were noted. E, OCRs in response to the TCA substrates pyruvate, malate, glutamate and succinate in each of the six tissue groups [17–19]. F, Immuno-blots of pyruvate kinase isoforms, PKM1 and PKM2 in the indicated tissues. No significant differences among the different tumor groups were noted. G, PFK activities were quantified on extracts from the indicated tissues. Each point represents the mean of duplicate assays of the same tissue. H, Heat map for transcripts encoding key glycolytic enzymes as well as the glucose transporter Slc2a1/GLUT1 and the rate-limiting enzymes 6Pgd and Shmt2. Each column depicts the mean expression of samples obtained from five randomly chosen mice. See S1A Fig for quantification of transcript levels. I, Immuno-blots for Slc2a1/GLUT1 in the indicated tissues. J, Expression of transcripts encoding cholesterol biosynthetic enzymes. See S1B Fig for the proper order of these enzymes along the pathway and S1C Fig for actual expression levels of each transcript across all tissues. K, Heat map for transcripts encoding key enzymes in the FAS pathway. These include malonyl-CoA-acyl carrier protein transacylase (Mcat), AcCoA carboxylase a&b (Acaca & Acacb), ATP citrate lyase (acly) and fatty acid synthase (Fasn). See S2A Fig for actual quantification of each transcript across all tissues. L, Heat map for transcripts encoding key enzymes in the FAO pathway. See S2B & S2C Fig for each transcript’s position in the FAO pathway and its actual quantification across all tissues, respectively. For panels H,J,K and L, each column represents the mean values obtained from five tissues.

