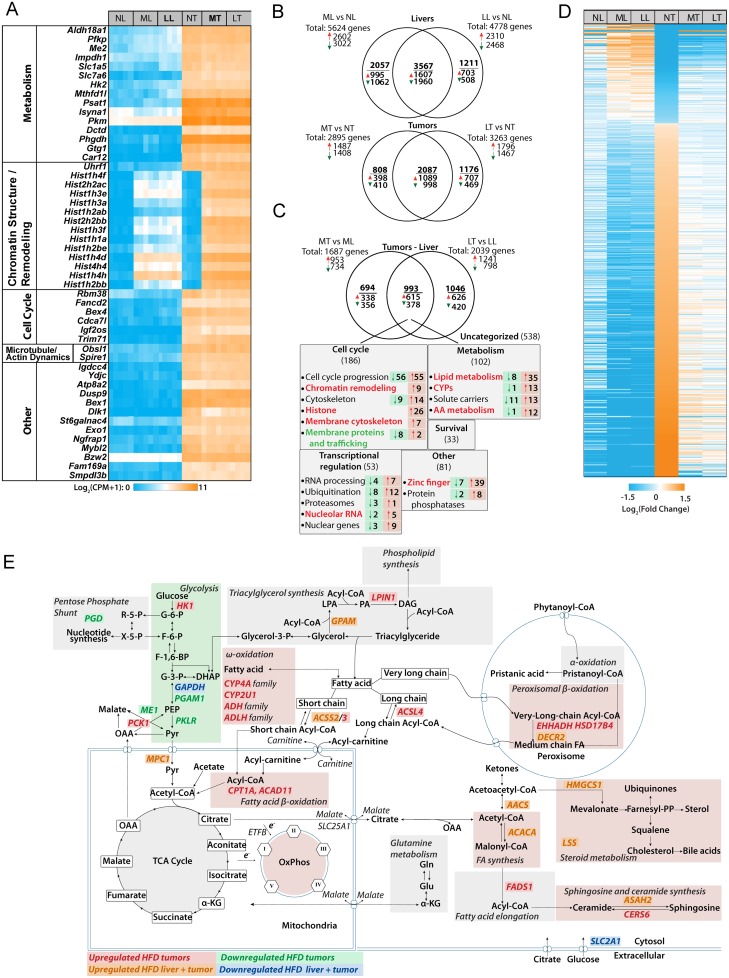
Fig 3. Differences among liver and tumor groups maintained on NDs or HFDs.
A, The 50 most highly de-regulated transcripts that distinguish livers and tumors. Transcripts are grouped according to their known or assumed functional categories. See S4 Fig for actual expression levels and S2 Table for the actual functional categories into which these transcripts could be grouped. B, Venn diagram of differential transcript expression among NFD livers and tumors and those maintained on MC-HFDs and LC-HFDs. C, Venn diagram of differential transcript expression that distinguishes NFD-tumors from MC-HFD tumors and LC-HFD tumors. The 993 common transcripts represent those that are uniquely deregulated only in tumors maintained on both HFDs. See S3 Table for a full list of these. D, Heat map of the 682 transcripts that are de-regulated in NFD tumors and normalized by both MC-LFDs and LC-HFD (q<0.05) (See S4 Table for the complete list of these transcripts and their expression levels in each of the tumor groups. E, Predicted pathway de-regulation in HFD tumors based on IPA predictions. The indicated genes are taken from C and D and S3 Table. They represent transcripts that de-regulated in NFD tumors and normalized by both MC-LFDs and LC-HFD.

