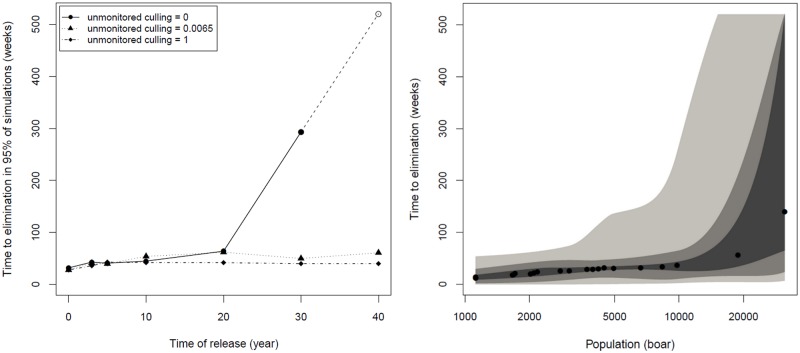
Fig 4. Time to elimination following an outbreak.
(Left) Plot shows the time to reach zero infected animals in 95% of model repetitions against year in which a single individual infected with FMD is released into the population for a range of potential management scenarios exploring the impact of unknown culling effort on land beyond the current distribution on publically owned land; culling levels tested simulate no culling (= 0), equal to FC land (= 0.0065) and complete removal (= 1). (Right) Plot shows the median time to reach zero infected animals (dots) against population size at time of release taken across all management scenarios. Shaded regions denote smoothed ranges centred on the median containing (from darkest to lightest): 50%, 90%, and 100% of model repetitions.

