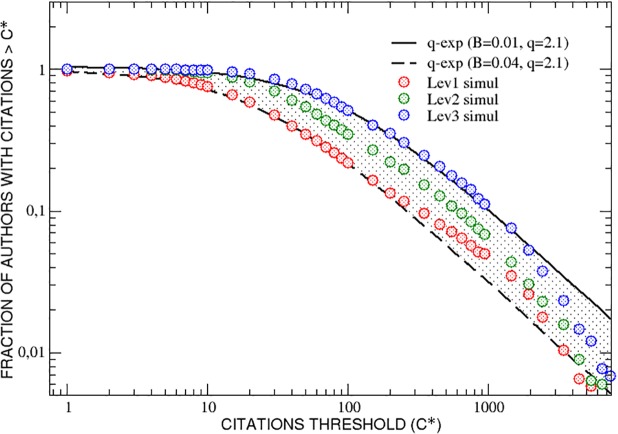
Fig 7. Model simulation.
The fraction of researchers who have collected, during their simulated careers, a number of citations greater than an increasing threshold C* is reported as function of C*. The three curves, corresponding to different interdisciplinarity classes, lie inside a range limited by two q-exponential functions with the same value for the entropic index q and different values of B.

