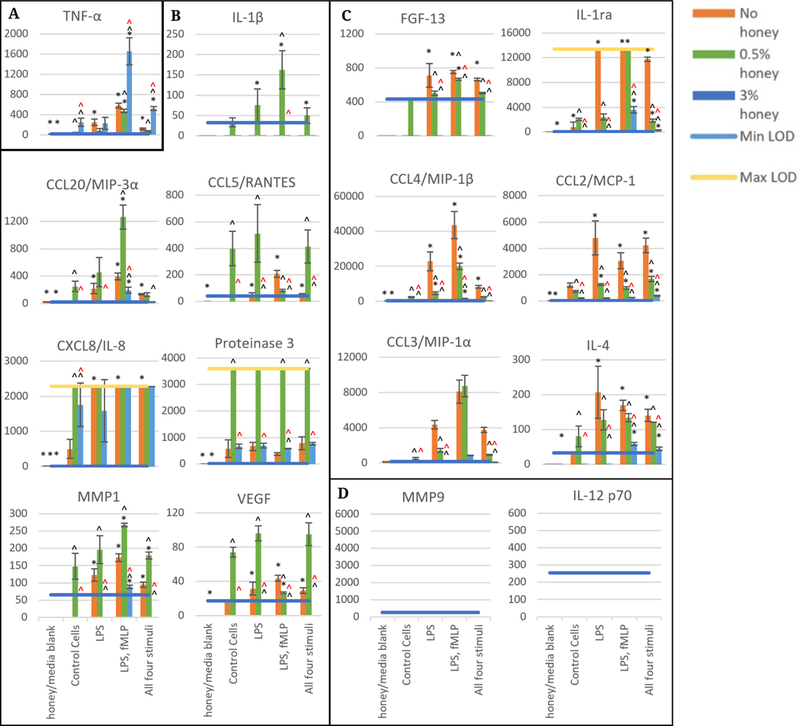
Figure 2.

Released levels at 3 hours in the absence of honey or presence of 0.5, and 3% Manuka honey. Scale bars are mean ± standard deviation. “*” indicates a statistically significant difference from the non-stimulated control at that respective honey level, “^” indicates a statistically significant difference from the non-honey group of that stimulation type, and “^” indicates a statistically significant difference from the 0.5% honey group of that stimulation type. A Kruskal-Wallis test was used with a Bonferroni adjustment for multiple comparisons to establish significant differences between stimulation types at each honey level and between honey levels at each stimulation type (α = 0.05). Analytes are grouped by trend (A–D). N = 3.
