Fig. 8.
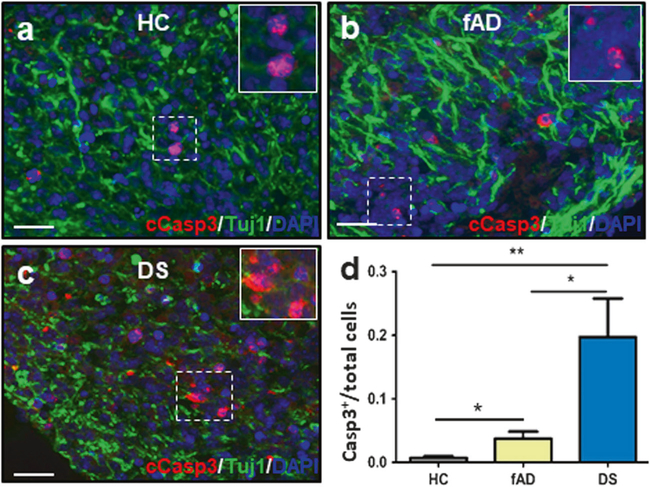
Analysis of cellular apoptosis in COs. a–c Cleaved caspase-3 (cCasp3, red) and Tuj-1 (green) staining for representative sections of COs made from a healthy control (HC), b familiar Alzheimer’s disease (fAD), or c Down syndrome (DS) iPSCs. Scale bars: 25 μm. D Immunofluorescence analysis of the ratio of cCasp3+ cells per total number of cells, as measured by DAPI staining. Data was analyzed by one-way ANOVA, and unpaired Student’s t-test. *P <0.05; **P <0.01

