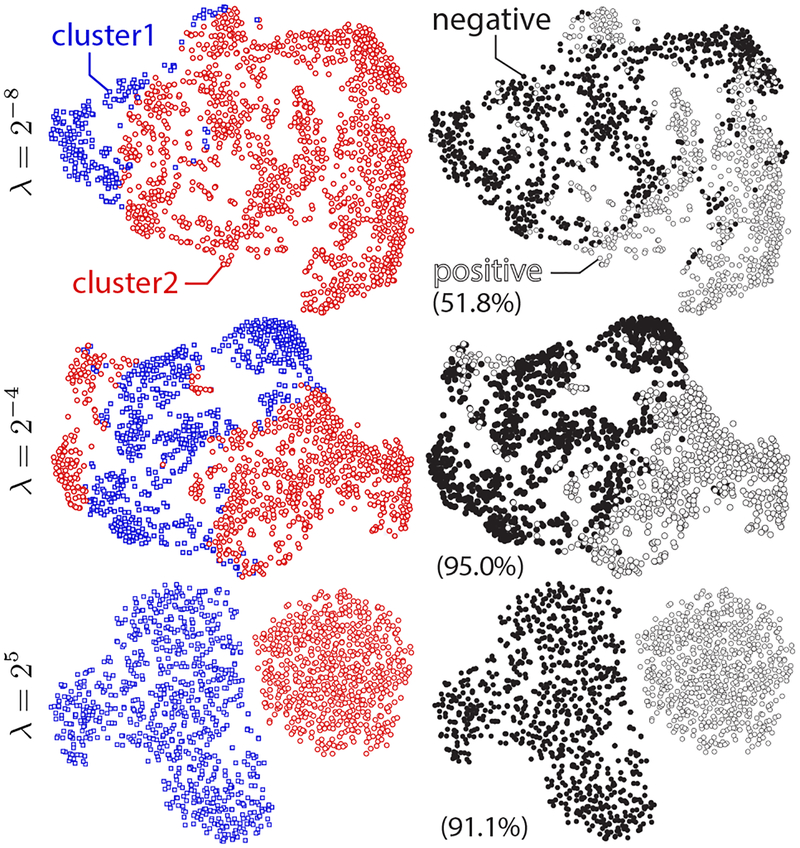
Figure 3.
Illustration of the learned W with different λ on real data of AU12. Each sample is colored by cluster ID (left column) or weak-annotations, i.e., positive v.s. negative (right column). Parentheses indicate the % of agreement between WSC re-annotation and ground truth (higher better). A good balance is found at λ = 2−4 where WSC achieved highest agreement.

