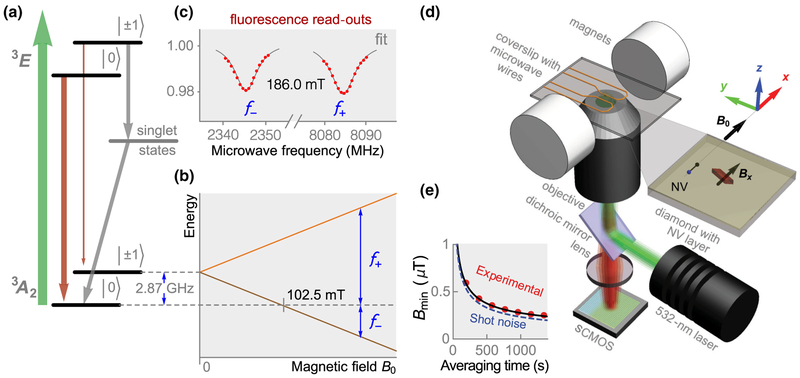
FIG. 1.
Diamond magnetic microscopy. (a) NV energy-level diagram depicting magnetic sublevels (|0〉, 1), optical (green arrow), fluorescence (red arrows), and nonradiative (gray arrows) pathways. Gray arrows excitation show spin-selective intersystem crossing leading to polarization into the |0〉 ground-state sublevel. (b) Energy splitting of the ground-state sublevels in an external magnetic field applied along the NV axis. Blue arrows indicate the f± microwave transitions. (c) Example of an ODMR spectrum. From the separation between peaks, the projection of the local magnetic field along the NV axis is inferred. (d) Epifluorescence ODMR microscope used for magnetic imaging. Dry hemozoin crystals are placed on top of a diamond substrate with an ~ 0.2-μm top layer doped with NV centers. (e) Experimental and photoelectron-shot-noise-limited detection threshold for 65 × 65 nm2 detection pixels versus averaging time. The experimental data are fit to the function with α = 8.4 ± 0.1 μT s1/2

