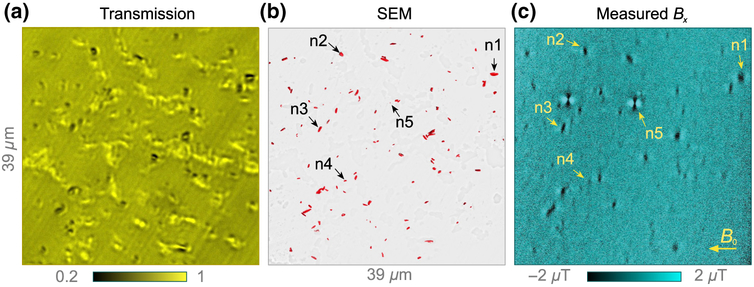
FIG. 3.
Natural hemozoin. (a) Bright-field transmission image of natural hemozoin crystals dispersed on a diamond substrate. The scale bar is the relative transmission. (b) SEM image of the same nanocrystals. To enhance hemozoin visibility, the SEM image is modified by a segmentation procedure, depicted in Fig. 7. (c) Diamond-magnetic-microscopy image for applied field B0 = 350 mT. Nanocrystals labeled n1–n5 are studied in detail in Figs. 4(a)–4(e).

