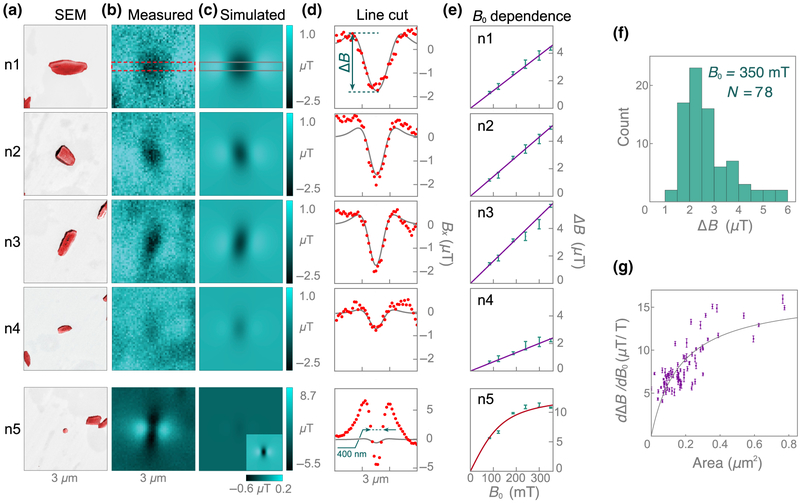
FIG. 4.
Magnetic imaging of individual natural hemozoin nanocrystals. (a) SEM images of hemozoin nanocrystals n1–n5, labeled in Fig. 3. (b) Corresponding diamond-magnetic-microscopy images (B0 = 186 mT) for each crystal. (c) Simulated magnetic images (χ = 3.4 × 10⁻⁴, B0 = 186 mT) obtained with nanocrystal dimensions inferred from (a). Only the crystal at the center of each SEM image is included in the model. (d) Line cuts of each nanocrystal (red, measured; gray, simulated), from which the field-pattern amplitude ΔB is inferred. A minimum feature width of ~ 400-nm FWHM is observed for n5, close to the optical diffraction-limited resolution of our microscope. (e) ΔB(B0) = 0 (zero-coercivity assumption). (f) Histogram of ΔB (B0 = 350 mT) of the 78 crystals exhibiting linear paramagnetic behavior (including n1–n4). The four crystals exhibiting superparamagnetic behavior (including n5) are excluded from the analysis. (g) Fitted slopes, dΔB/dB0, as a function of crystal area, A, as determined from SEM images. The data are fitted with an empirical saturation function, dΔB/dB0 = Smax/(1 + Asat/A), with Smax = 16.5 ± 1.4 μT/T and Asat = 0.17 ± 0.03 μm2.

