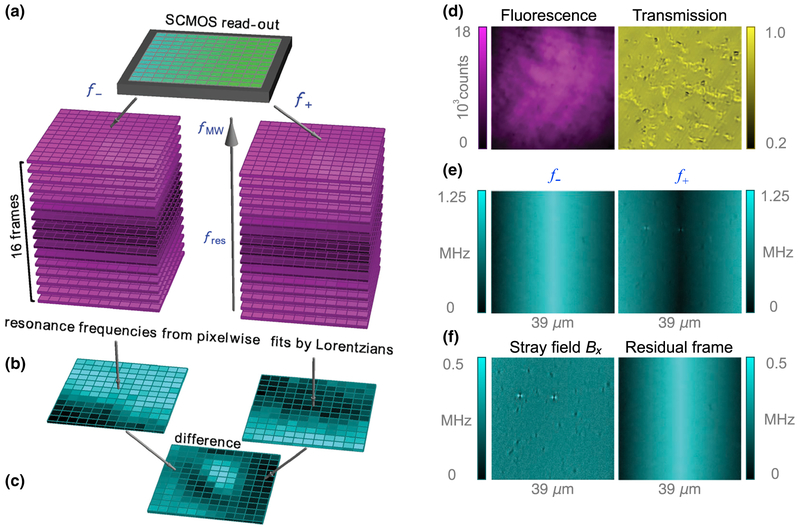
FIG. 9.
Data processing. (a) Fluorescence images are acquired at each of 32 different microwave frequencies (16 frequencies for each of the f± spin transitions). (b) For any given pixel, two 16-point ODMR curves (fluorescence intensity versus microwave frequency)are generated. Each ODMR curve is fit to a Lorentzian function to reveal the ODMR central frequencies for that pixel. This is repeated for each pixel, yielding two maps of ODMR central frequencies corresponding to f+ and f−. (c) The magnetic field pattern is obtained by subtraction of the images for f+ and f−, division by 2γNV, and subtraction of the applied B0 field. (d) An example fluorescence image for a fixed microwave frequency along with a bright-field transmission image of the same field of view. (e) Intermediate step showing separate maps for frequencies f+ and f−. (f) The final taken at B0 = 350 mT, is proportional to stray magnetic fields, γNVBx =(f+ − f−)/2 − γNVB0. This is shown alongside a map of residual nonmagnetic shifts, (f+ f−)/2 − 2D. Note that f− is defined such that it is negative when | −1〉 is lower in energy than |0〉. The horizontally varying pattern is an artifact of the sCMOS camera’s read-out dual-sensor This artifact is present when rolling-shutter mode is used, but is eliminated by our subtraction procedure.

