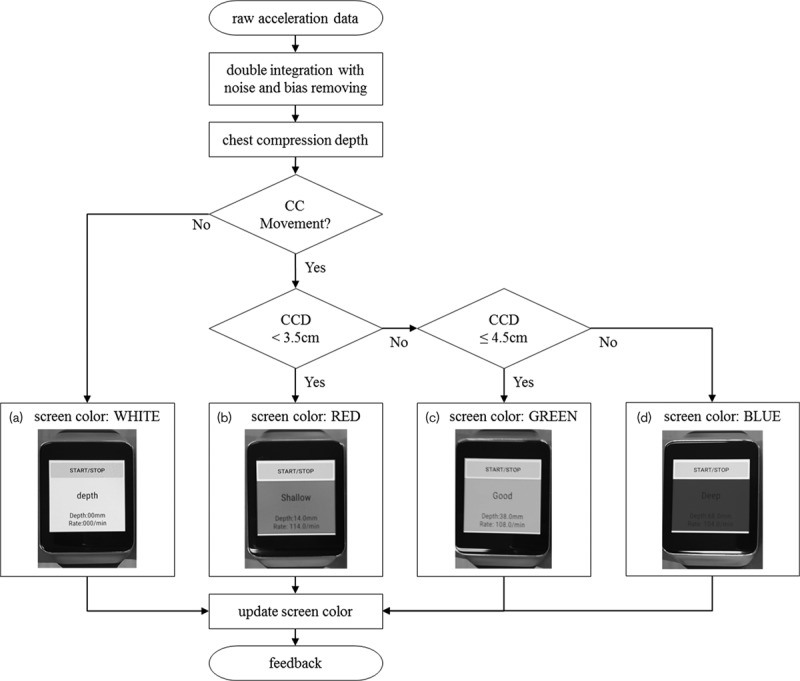
Fig. 2.

Flowchart of chest compression (CC) feedback. (a) White was shown when the smartwatch was not moved. (b) Red was shown on the display of smartwatch when the depth was less than 3.5 cm, (c) green was shown when the depth was between 3.5 and 4.5 cm and (d) blue was shown when the depth was more than 4.5 cm.
