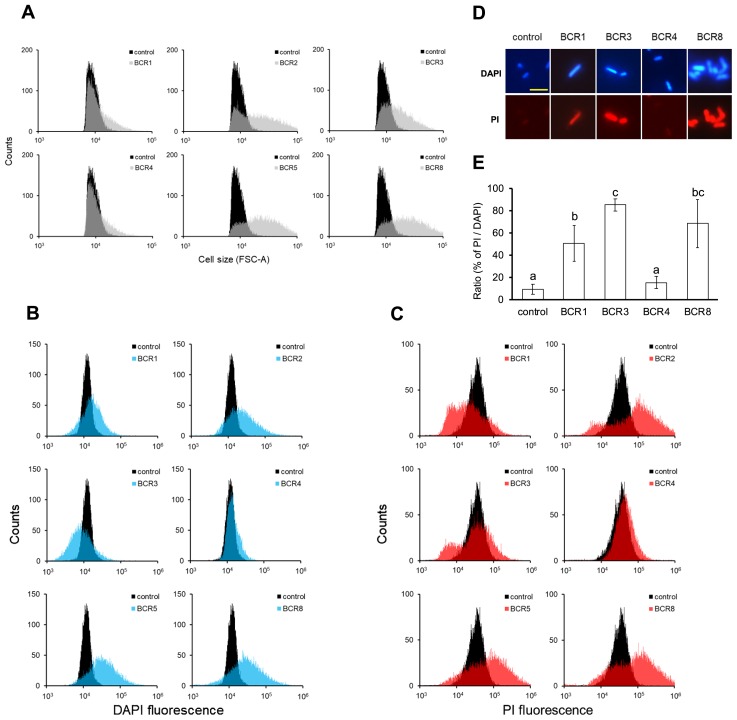
Fig. 2.
Effects of BCR peptides on E. coli cells. E. coli MG1655 cells were treated for 3 h with 5 μM of the BCR peptide or BSA as the control. Cells were stained with DAPI and PI and analyzed by a cell sorter. (A) Forward scatter (FSC), (B) DAPI, (C) PI. (D) Fluorescent microscopy of MG1655 cells treated with BCR peptides and stained with DAPI and PI. Images are representative micrographs of cells treated with each peptide. Scale bars, 5 μm. (E) Ratio of PI-positive cells to DAPI-stained cells. At least 4,000 cells were counted in each treatment. Each value is the mean±SE. Means denoted by the same letter do not differ significantly (P<0.05, the Student’s t-test).

