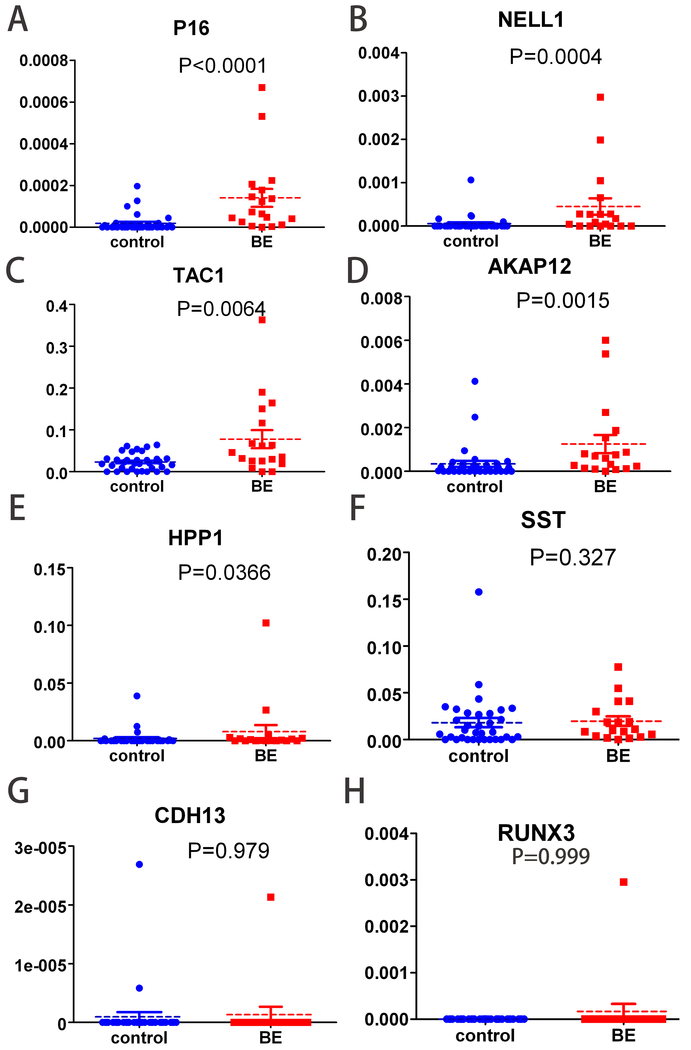
Figure 3:
Methylation values of 8 genes in sponge DNAs from BE cases vs. control subjects. Methylation values of p16(A), NELL1(B), TAC1(C), AKAP12(D) and HPP1(E) were significantly higher in BE than controls (p<0.0001, p=0.0004, p=0.0064, p=0.0015, and p=0.0366, respectively), but differences for SST(F), RUNX3(G), and CDH13(H) were not significant (p=0.327, p=0.979, and p=0.999).

