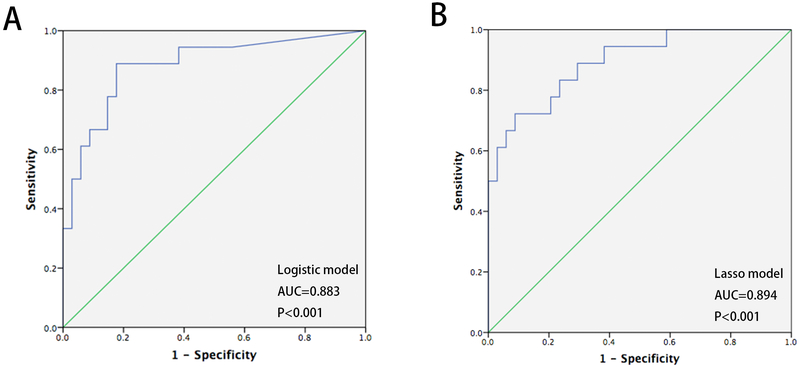
Figure 5:
ROC curves showing diagnostic performance of logistic regression and LASSO models in sponge samples from BE cases and controls in the training set. (A) AUC for logistic regression model based on p16 (CDKN2A) and NELL1 = 0.883, P<0.001; (B) AUC for LASSO model based on 4 biomarkers plus age = 0.894, P<0.001.

