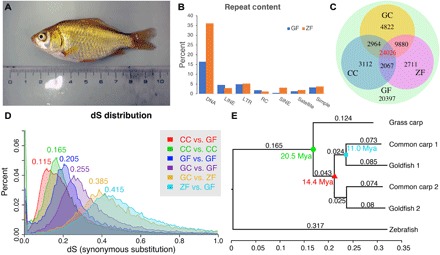
Fig. 1. Basic statistics for the goldfish genome in comparison to grass carp, common carp, and zebrafish.

(A) The gynogenetic goldfish used for sequencing before sacrifice. (B) Transposable elements distribution for goldfish (GF) and zebrafish (ZF). (C) Distribution of orthologous/ohnologous gene pairs by synonymous substitution among four species: zebrafish, grass carp (GC), common carp (CC), and goldfish. Numbers are a count of the homologous genes shared among zebrafish, common carp, and goldfish. (D) Rate of synonymous base changes (dS) for various species comparisons. (E) The phylogenetic tree shows the time of divergence of grass carp from goldfish and common carp (green circle), the WGD (red triangle), and divergence common carp and goldfish (cyan square). Each genome from the duplication was analyzed separately (chromosomes randomly assigned) and are denoted with _1 or _2 for both common carp and goldfish. (Photo credit: Yoshihiro Omori, Osaka University).
