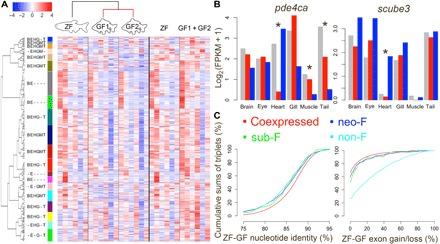
Fig. 5. Systematic analysis of gene expression changes between duplicated genes can detect gene extinction, sub-F, and neo-F events.

(A) Genes clustered into 20 groups for the 8483 zebrafish-goldfish gene triplets. Heatmap and the keys indicate the normalized value (z score) of log2(FPKM + 1). The left color bar indicates different clusters, the text next to the cluster color bar indicates major zebrafish-expressed tissue in each cluster, and unlabeled ones are expressed in all zebrafish tissues. B, brain; E, eye; H, heart; G, gill; M, muscle; T, tail fin. (B) Example of expression of subfunctionalized (left) and neofunctionalized (right) genes. Gray bar, zebrafish; red and blue bar, two goldfish orthologs. Asterisks indicate tissue(s) associated with sub-F or neo-F. (C) Cumulative sum of triplets in different zebrafish-goldfish nucleotide identity groups (left) and exon gain/loss groups. Genes in non-F, neo-F, and sub-F triplets have low nucleotide identity and higher exon gain/loss than the coexpressed group. Genes in sub-F and neo-F triplets have medial exon gain/loss.
