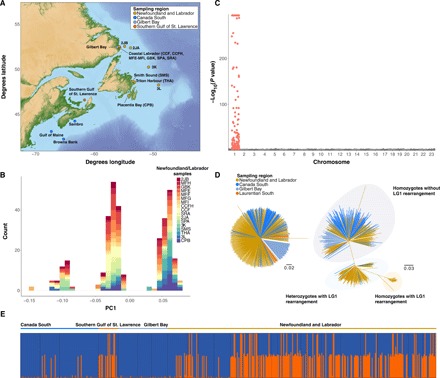
Fig. 1. Map of Atlantic cod (G. morhua) sampling locations in the Northwest Atlantic and genetic structuring across all sampled sites and within Northern cod.

(A) Sampling sites across North America color coded by population. (B) Genetic structure within Northern cod visualized using the first PC calculated from 6030 SNPs in pcadapt. Colors correspond to sample groups taken from sites within the Northwest Atlantic cod population. (C) Genomic sources of individual-level genetic variation within Northern cod assessed by significance of correlation (P value) of each SNP locus with the first PC axis obtained from transformed Mahalanobis distances. SNPs within the LG1 rearrangement are colored in red. (D) Individual neighbor-joining trees for 511 individuals from all sampling locations calculated using 2500 randomly selected SNPs outside of Northern cod rearrangements (left) and 237 SNPs in the LG1 rearranged region (right). (E) Bayesian clustering results from STRUCTURE for 237 SNPs in the LG1 rearranged region calculated among all 511 individuals from all sampling locations for K = 2 genetic clusters. The LG1 inverted genetic background is represented in orange, and the LG1 noninverted genetic background is represented in blue.
