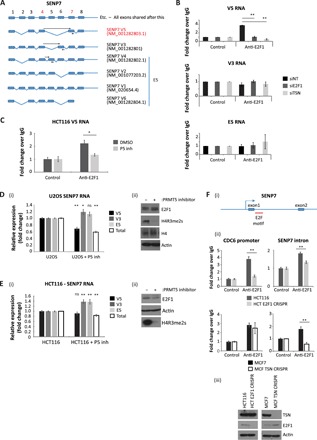
Fig. 4. p100/TSN enables E2F1 to interact with alternatively spliced transcripts.

(A) Schematic representation of exon structure for the SENP7 gene. Each alternatively spliced transcript expressed from this gene is displayed, with primer binding sites used to detect specific transcript variants in subsequent experiments indicated with black arrows. Note that forward primers were designed to span exon junctions. Mining of the RIP-seq dataset for exon spanning peaks identified reads around exons 4 and 7 (indicated by the red numbering), which occurs in SENP7 transcript V5 (highlighted in red text). (B) Anti-E2F1 RIP with U2OS cells treated with siRNA against E2F1, TSN, or nontargeting (NT) control, as indicated, for 72 hours. Cells were then immunoprecipitated with E2F1 antibody, and coimmunoprecipitated RNA was reverse-transcribed before qPCR analysis with primers against specific SENP7 transcript variants as indicated. n = 3. (C) HCT116 cells were treated with 5 μM PRMT5 inhibitor, where indicated, before performing an anti-E2F1 RIP. Coimmunoprecipitated SENP7 V5 transcripts were analyzed by qRT-PCR. Input protein levels are the same as those displayed in Fig. 3E. n = 2. DMSO, dimethyl sulfoxide. (D) U2OS cells were treated for 72 hours with 5 μM PRMT5 inhibitor. RNA was then isolated from cells and analyzed by qRT-PCR using primers targeting specific SENP7 transcript variants or total SENP7 RNA. Average (mean) fold change of each RNA species as compared to untreated U2OS cells was calculated and displayed with SE. Statistical analysis for each condition compared to untreated U2OS cells is also displayed over each bar (i). An immunoblot to demonstrate input protein levels is also included (ii). n = 3. (E) As described above, although the experiment was performed in HCT116 cells. n = 4. ns, not significant. (F) Examination of the promoter region of the SENP7 gene (–2 to +1 kb) identified an E2F1 DNA binding motif within +450 bp of the transcription start site, lying within the first intron (E2F1 motif marked in red) (i). An E2F1 ChIP was performed in the HCT116 E2F1 CRISPR and MCF7 TSN CRISPR cell lines. Immunoprecipitated chromatin was analyzed using primers spanning the identified E2F DNA binding motif in SENP7 or against the known E2F motif in the promoter sequence of CDC6 (ii). An immunoblot is included to demonstrate input protein levels (iii). n = 3
