
Fig. 2.
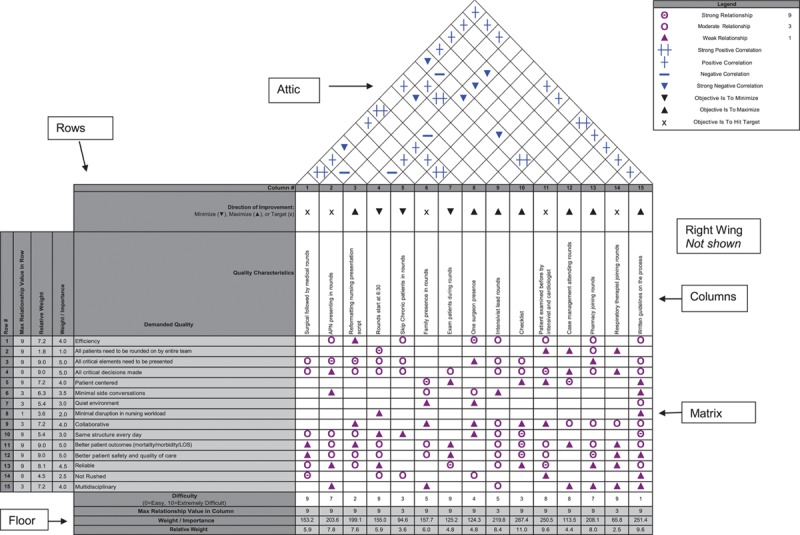
House of Quality (customer-demanded quality as rows and design team’s options as columns). Matrix showing interrelationships, depicted by symbols. Legend box shows values of the symbols. Refer to the text for description.
Official websites use .gov
A
.gov website belongs to an official
government organization in the United States.
Secure .gov websites use HTTPS
A lock (
) or https:// means you've safely
connected to the .gov website. Share sensitive
information only on official, secure websites.
House of Quality (customer-demanded quality as rows and design team’s options as columns). Matrix showing interrelationships, depicted by symbols. Legend box shows values of the symbols. Refer to the text for description.