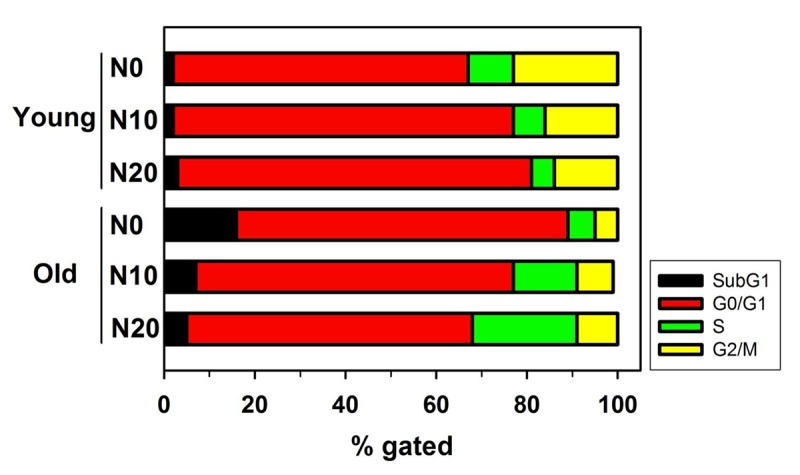
Figure 3.

Flow cytometry for analysis of cell cycle and apoptosis. Graph shows the relative percentage of cells of the indicated genotype in the subG1, G0/G1, S, and G2/M phases of the cell cycle. Young and old HDFs were treated with either vehicle or NecB (10 or 20 μg/mL) for 16 h, stained with PI, and then analyzed by flow cytometry.
