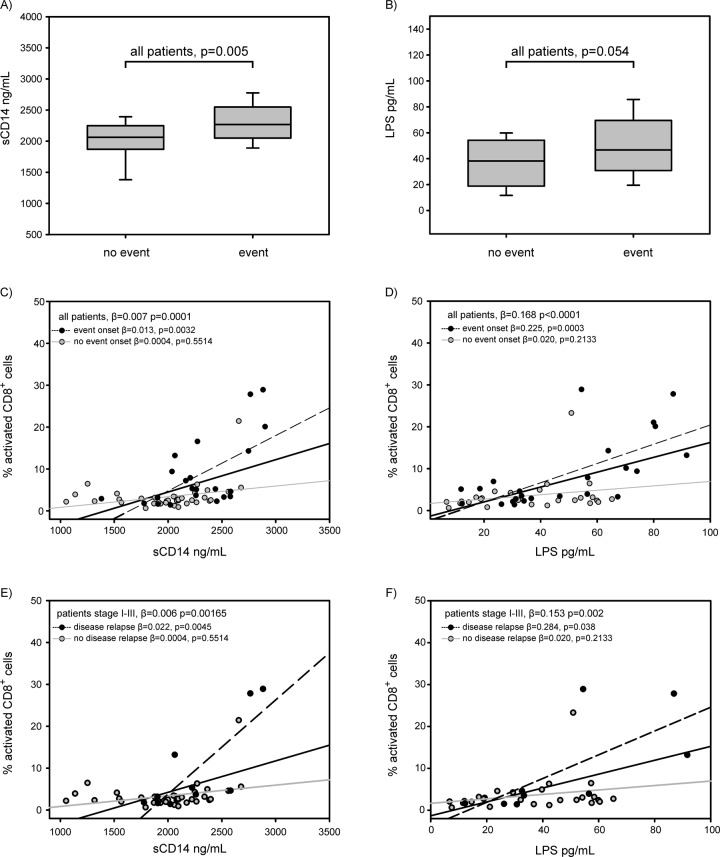
Figure 3.
PAMPs and immune activation. (A) sCD14 and (B) LPS levels in patients who will or not experience a negative event (relapse or progression or death). (C) sCD14 and (D) LPS levels as function of percentages of activated CD8+ cells in all patients. Regression line for all 81 patients is represents in bold black; patients who will experience a negative event are represented as black circles and medium dash line, and patients who will not as grey circles and line. (E) sCD14 and (F) LPS levels as function of percentages of activated CD8 cells in I-III staged patients. Regression line for all 61 patients is represent in bold black; patients who will have a disease relapse are represented as black circles and medium dash line, and patients who will not as grey circles and line.

