Figure 2.
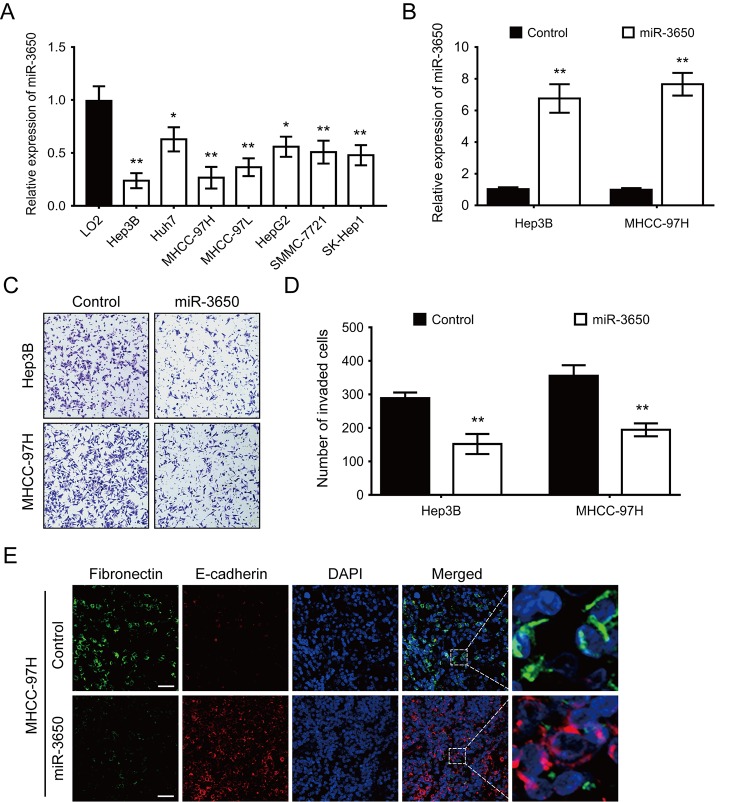
Forced expression of miR-3650 inhibits HCC migration and EMT in vitro. (A) Relative expression of miR-3650 in HCC cell lines (Hep3B, Huh7, MHCC-97H, MHCC-97L, HepG2, SMMC-7721 and SK-Hep1) compared with that of the immortalized liver cell line LO2. Data was presented as expression fold change relative to LO2. (B) RT-PCR analysis of miR-3650 mRNA levels in Hep3B and MHCC-97H cells transfected with miR-3650 mimics or control mimics. (C) and (D) Representative images and quantification of migration of Hep3B and MCHH-97H cells after miR-3650 overexpression by transwell assays. (E) Representative images of immunofluorescence micrographs of the localization and expression of Fibronectin (green) and E-cadherin (red). Nuclei were counterstained with DAPI (blue). Scale bars represent 50 μm. For all quantitative results, the data are presented as the mean ± SD from three independent experiments. * P < 0.05 and ** P < 0.01.

