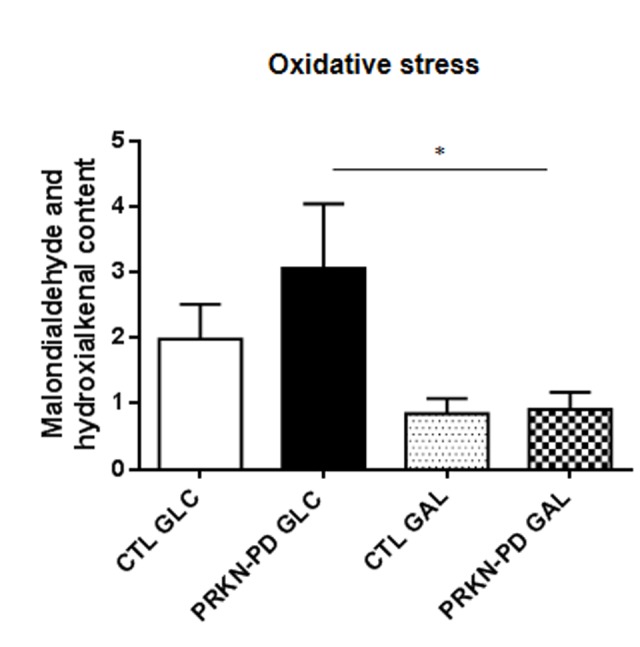
Figure 4.

Oxidative stress measured through lipid peroxidation in control and PRKN-PD fibroblasts. In glucose, PRKN-PD exhibited an upward trend in lipid peroxidation compared to control fibroblasts while exposure to galactose significantly reduced oxidative stress levels in PRKN-PD compared to glucose. The results are expressed as means and standard error of the mean (SEM). *= p<0.05. CTL= Control fibroblasts. GAL= 10 mM galactose medium. GLC= 25 mM glucose medium. PRKN-PD= Parkin-associated PD fibroblasts.
