
Figure 1.
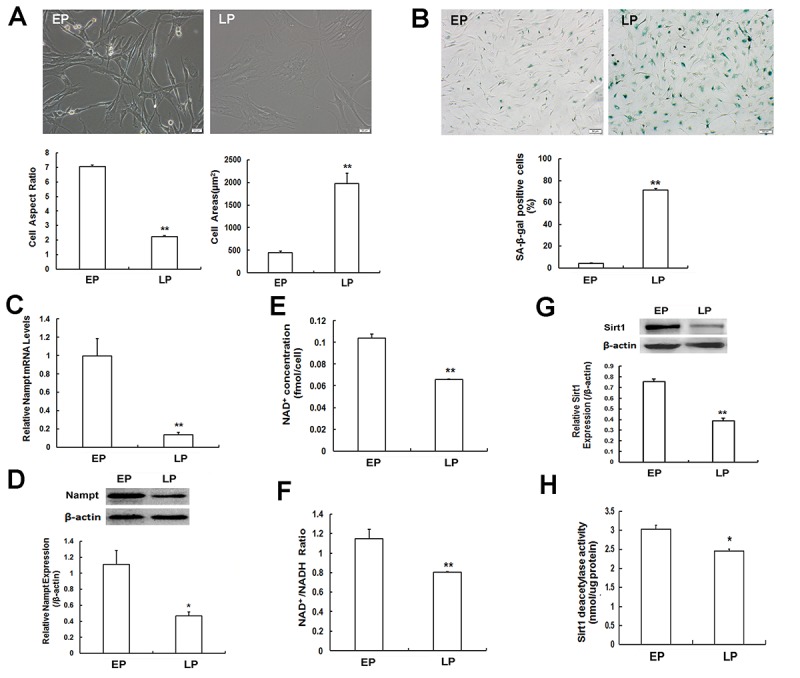
Senescence-associated variations in mesenchymal stem cells (MSCs) and measurement of Nampt expression and NAD+-Sirt1 signaling. (A) Morphological characteristics of young MSCs at early passage (EP, P3) and replicative senescent MSCs at late passages (LP, P10) (Scale bar = 20 μm) and analysis of cell aspect ratio and cell surface area. (B) SA-β-gal staining (scale bar = 50 μm) and quantitative analysis of SA-β-gal-positive cells. (C) Nampt mRNA expression determined by RT-qPCR. (D) Nampt protein expression determined by western blotting. (E, F) Detection of intracellular NAD+ concentration (E) and NAD+/ NADH ratio (F). (G, H) Sirt1 protein expression evaluated by western blotting (G) and detection of Sirt1 deacetylase activity (H); n = 3 independent experiments. *P < 0.05, **P < 0.01.