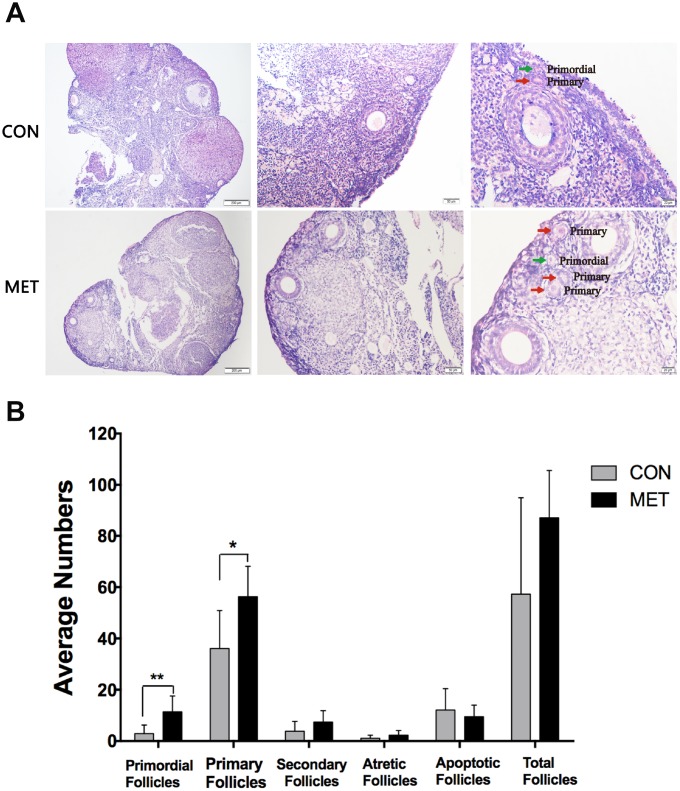
Figure 3.
Effect of MET feeding for 6 months on follicle numbers at different stages. (A), The histological images of the ovaries in the CON and MET groups. The green and red arrows show primordial and primary follicles respectively. (B). The average number of follicles in each stage in the two groups. Data were presented as the mean± S.E.M. *indicates a significant difference from the CON group. *P<0.05, **P < 0.01.

