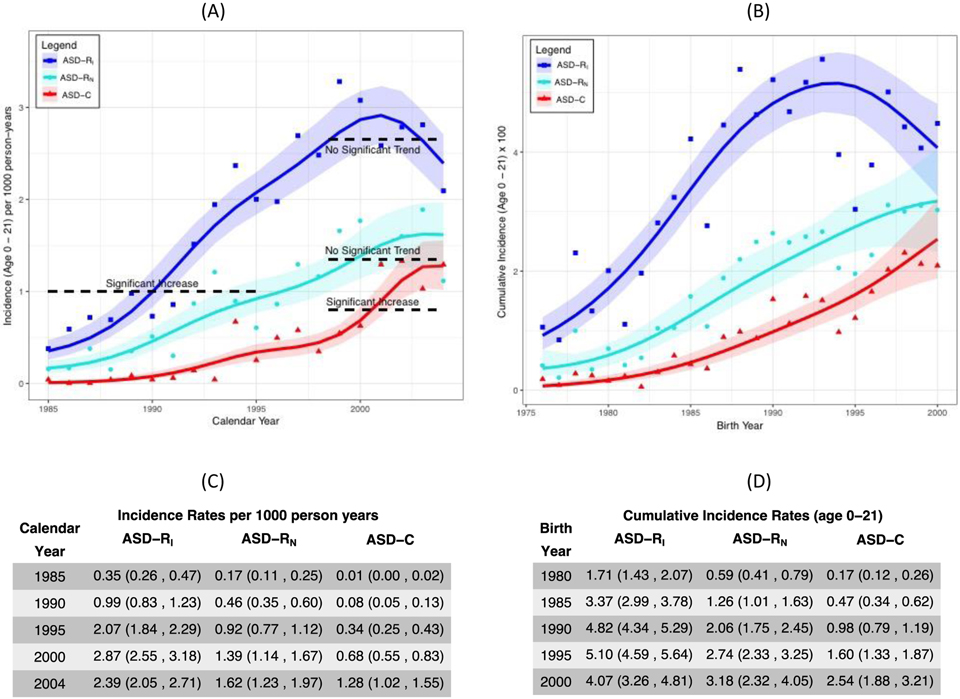
Fig. 2.
(A) Incidence by age 21 (per 1000 person-years) of research-identified inclusive (ASD-RI) and narrow (ASD-RN) autism spectrum disorder and clinically diagnosed autism spectrum disorder (ASD-C), according to calendar year of first meeting criteria and averaged across gender. See body of text in the Results section for explanation of the horizontal dotted lines used to draw statistical inference with respect to trends. (B) Cumulative incidence by age 21 (×100) of research-identified autism spectrum disorder (ASD-RI and ASD-RN) and clinically diagnosed autism spectrum disorder (ASD-C), according to birth year and averaged across gender. The solid curves for both (A) and (B) are the respective posterior mean estimates for ASD-RI, ASD-RN and ASD-C incidence, while the bands are 95% simultaneous credible bands; 95% of curves from the posterior distribution will fall entirely within these bands. (C) Numerical data corresponding to (A). (D) Numerical data corresponding to (B).

