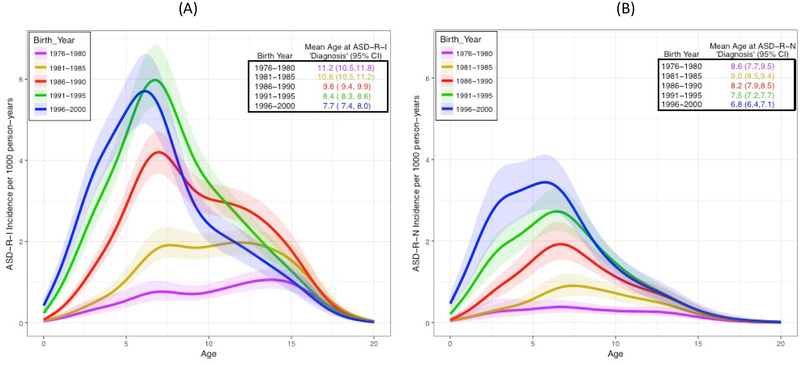
Fig. 4.
The age-specific incidence per 1,000 person-years for five separate birth periods (averaged across calendar year) for (A) ASD-RI and (B) ASD-RN. The solid curves are the respective posterior mean estimates for ASD-RI and ASD-RN incidence, while the bands are 95% simultaneous credible bands; 95% of curves from the posterior distribution will fall entirely within these bands.

