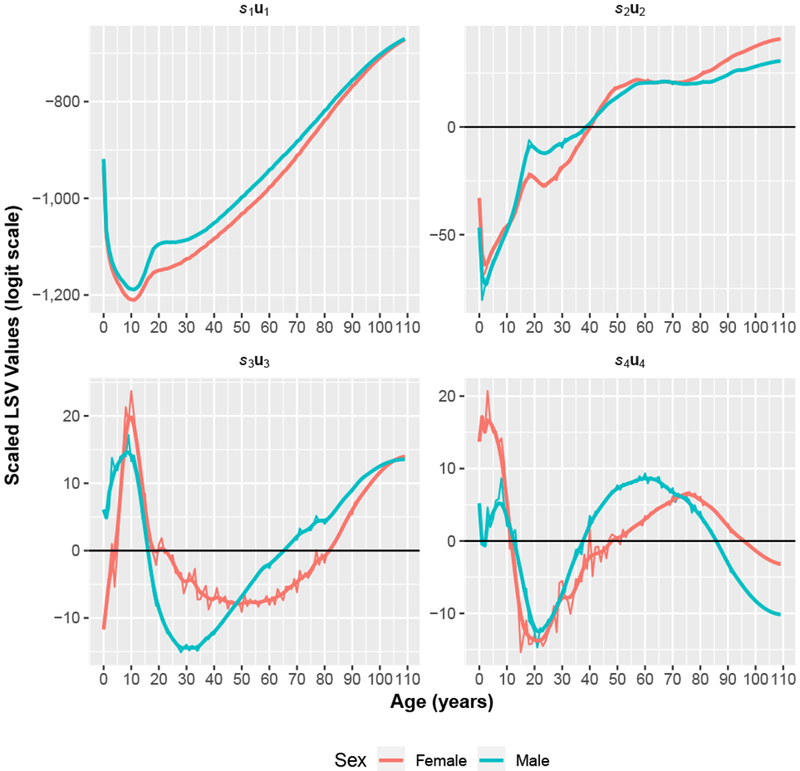
Fig. 2.

Scaled left singular vectors (LSVs). The first four LSVs are scaled by their corresponding singular values from the SVD of the 4,610 mortality schedules in the HMD. The more variable lines are raw components, and the less variable lines are smoothed with a kernel smoother. The raw values are used throughout this work.
