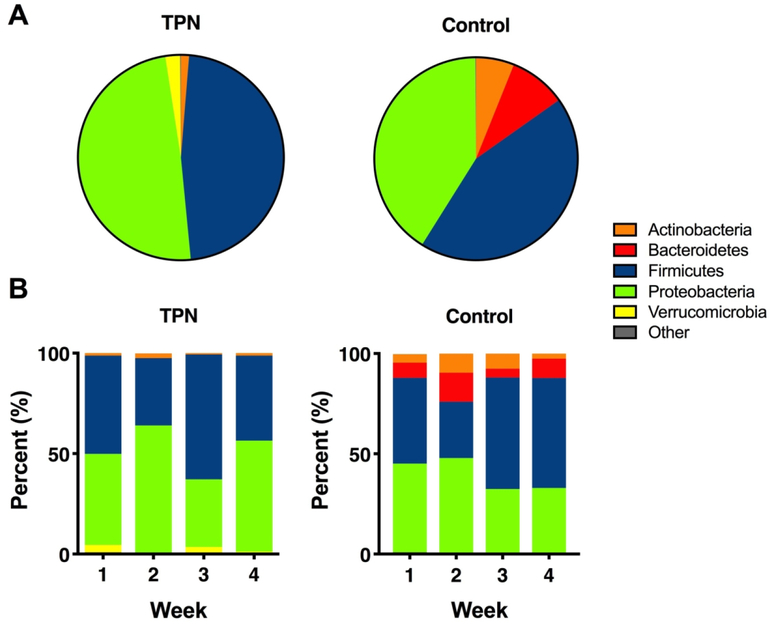
Figure 1. Taxonomic differences between TPN and control groups.
(A) Pie chart showing the overall differences in the relative abundance of the most abundant phyla between TPN and control groups. Taxa with <1% relative abundance were combined as “Other”. (B) Stacked bar graphs showing longitudinal differences in the relative abundance of the dominant phyla between TPN and control groups in the first 4 weeks of life.

