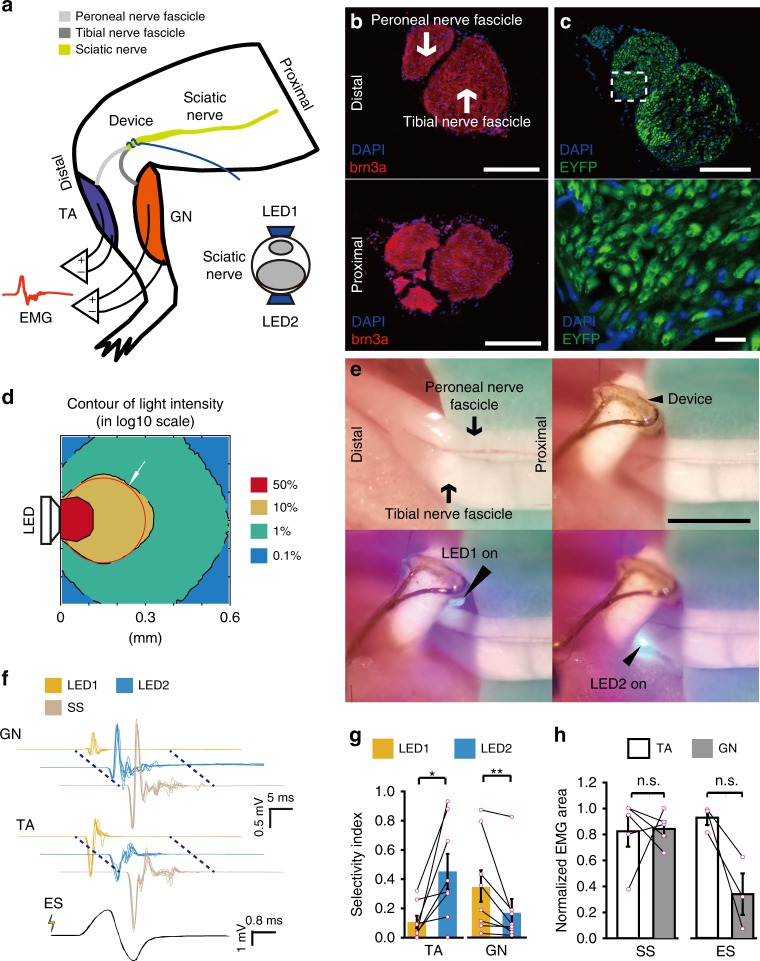
Fig. 3.
MOSD stimulation of the sciatic nerve in Thy1-ChR2 mice. a Schematic diagram of the MOSD attached to the distal side of a sciatic nerve. Stimulation was provided at 0.2 Hz (turned on for 20 msec-on/5 sec-off). Electromyography was performed on the tibialis anterior muscle (TA) and gastrocnemius muscle (GN). b Cross section of the sciatic nerve at the location of the MOSD (upper panel) and 4 mm from the location of the MOSD (lower panel). Red staining is brn3a, and blue staining is DAPI. c Transverse section of the sciatic nerve. Green staining is ChR2-EYFP, and blue staining is DAPI. d Monte-Carlo simulation of mini-LED light intensity across and around the mouse sciatic nerve. The red circle indicates the sciatic nerve in adult mice with a 300-μm diameter. e Mini-LED1 and 2 of the MOSD positioned on the distal side of the sciatic nerve to stimulate peroneal and tibial nerve fascicles at 0.026 mW (20 msec on-2sec off), respectively. f Representative electromyogram recorded from the TA and GN by different mini-LEDs of MOSD (20. 4 mW power, calculated light intensity at the distal end was 134.8 mW mm−2, 20 msec-on/2 sec-off), single-site optogenetic stimulation (81.6 mW power, calculated light intensity at the distal end was 539.2 mW mm−2, 20 msec-on/2 sec-off) and electrical stimulation in mice. The electrical stimulation pulse was 0.6 mA for 0.2 msec. g, h Normalized myoelectric area of the TA and GN in response to different mini-LED stimulations (n = 8 mice, 1.31 mW–20.4 mW, 20 msec-on/2 sec-off, TA: Paired t-test, GN: Wilcoxon Signed Rank Test), single-site optogenetic stimulation (n = 5 mice, paired t test) and electrical stimulation (n = 3 mice, 4.55 mW, 20 msec-on/2 sec-off, Paired t-test). SS: Single-site optogenetic stimulation; ES: electrical stimulation. Data are presented as mean ± s.e.m.; *P < 0.05, **P < 0.01. Scale bars are 100 µm (b, c (top)), 10 µm (c (bottom)) and 200 µm (e)

