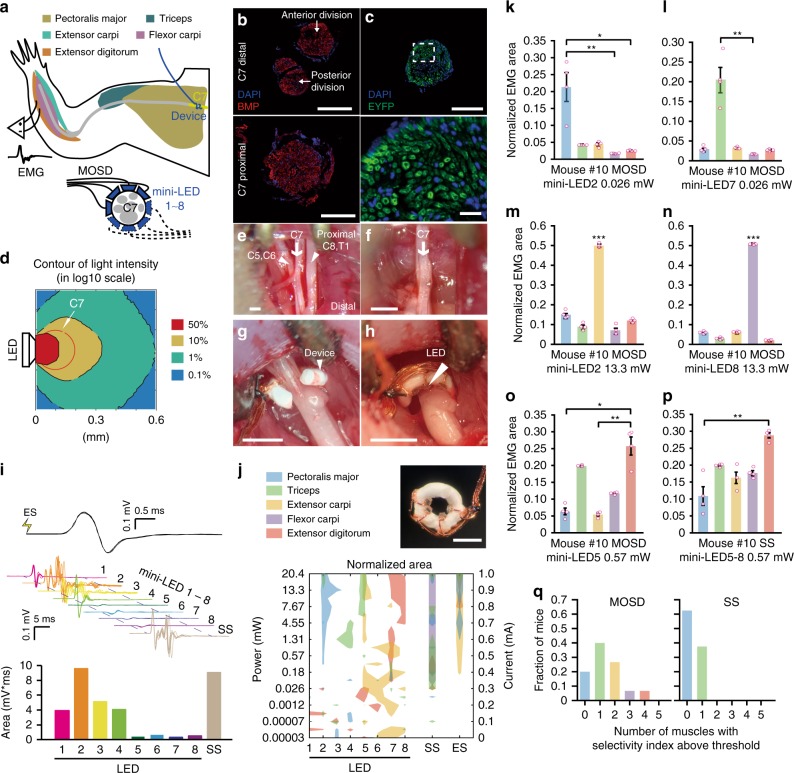
Fig. 5.
MOSD stimulation of C7 nerve bundle in Thy1-ChR2-EYFP mice. a Schematic of experimental set-up. MOSDs were implanted on the proximal side of C7 nerve bundle and electromyography was recorded. b Immunofluorescence staining of C7 nerve at distal side (upper) and proximal side (lower). Red, BMP. Blue, DAPI. c Expression of EYFP in C7 nerve of Thy1-ChR2-EYFP mice. Green, EYFP. Blue, DAPI. d Monte-Carlo simulation of mini-LED light intensity across and around C7 nerve. e–h Illustration of MOSD implantation process on C7 nerve. e Identification of C5–8 and T1 nerves. f excise C5–6, 8, and T1 nerves. g MOSD implanted on the proximal side of C7 nerve. h MOSD was turned 180°. i Representative electromyogram from Triceps by different mini-LEDs (20.4 mW, 20 msec-on/2 sec-off, calculated light intensity at the mini-LED: 888 mW mm−2; in the middle: 602 mW mm−2; at the far end: 267 mW mm−2) of MOSD, single-site optogenetic (SS) (81.6 mW, 20 msec-on/2 sec-off), and electrical stimulation (ES) (0.6 mA, 0.2 msec-on/1 sec-off) in one mouse. Myoelectric area was presented below. j MOSD (top right) with mini-LED (bottom) representative response pattern of Pectoralis major (PM), Triceps (Tr), Extensor carpi (EC), Flexor carpi (FC), and Extensor digitorum (ED) by different mini-LEDs of MOSD, SS and ES in one mouse. Left Y axis: mini-LED light power. Right Y axis: current used for ES. k–o Representive mouse showed selectivity for PM, Tr, EC, FC, and ED by MOSD (n = 4 trials. k, l, o- Friedman’s ANOVA on Ranks with Tukey post hoc; m, n: One way ANOVA with Tukey post hoc, *P < 0.05, **P < 0.01, ***P < 0.001). p The same mouse showed selectivity in only one muscle by SS. **P < 0.01, n = 4 trials, Friedman’s ANOVA on Ranks with Tukey post hoc. q Summarized distribution of the fraction of mice with numbers of muscles which showed selectivity (n = 15 mice for MOSD, n = 8 mice for SS). Data are presented as mean ± s.e.m. Scale bars are 100 µm (b, c (top)), 10 µm (c (bottom)) and 400 µm (e–h, j (top right))

