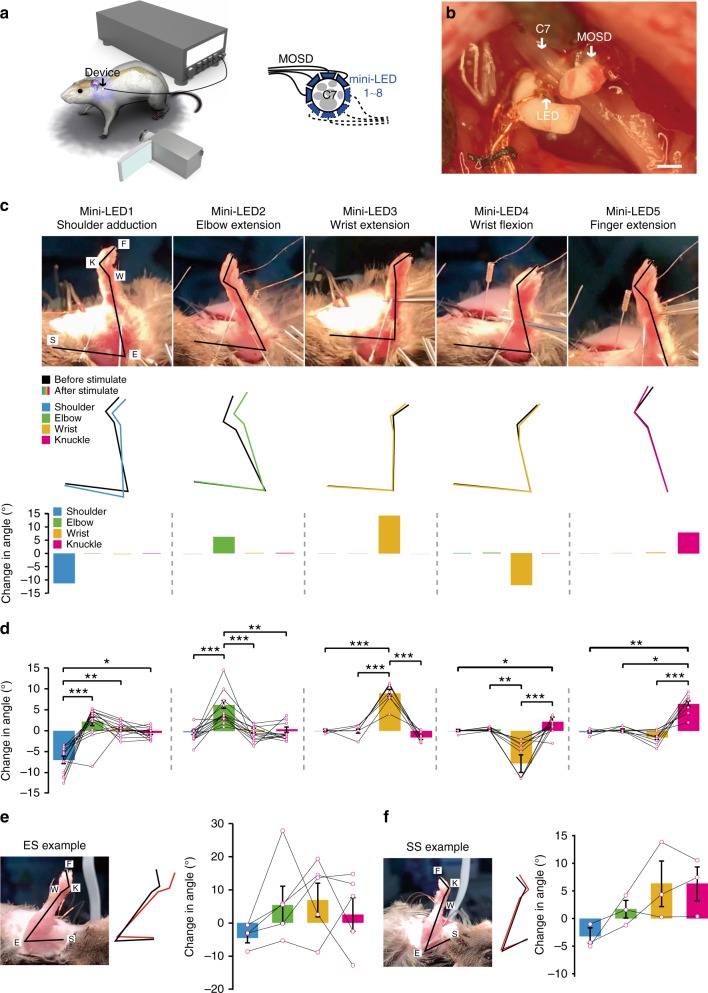
Fig. 6.
MOSD induced distinct upper limb movement in Thy1-ChR2 mice. a Schematic of C7 nerve implanted with MOSD and experimental set-up. b Image of MOSD wrapped around C7 nerve bundle. c Representative images of upper limb movement elicited by different mini-LEDs of MOSD (20.4 mW, 20 msec-on/2 sec-off, calculated light intensity at the mini-LED: 888 mW mm−2; in the middle: 602 mW mm−2; at the far end: 267 mW mm−2). F, fingertip. K, knuckle. W, wrist. E, elbow. S, shoulder. Black line represented the position of upper limb before mini-LED stimulation. Colored line represented the position of upper limb after mini-LED stimulation. d Joint angle movement of shoulder, elbow, wrist, and knuckle response to mini-LEDs (shoulder adduction, n = 14 mice; elbow extension, n = 14 mice; wrist extension, n = 7 mice; wrist flexion, n = 12 mice; finger extension, n = 10 mice) in 1.31–20.4 mW (20 msec-on/2 sec-off) (shoulder adduction, elbow extension, wrist flexion, finger extension: Friedman’s RM ANOVA on Ranks with Tukey post hoc; wrist extension: One way RM ANOVA with Tukey post hoc. *P < 0.05, **P < 0.01, ***P < 0.001). e Representative images of upper limb movement elicited by electrical stimulation (ES) (0.8 mA, 0.2 msec-on/1 sec-off). Joint angle movement of shoulder, elbow, wrist, knuckle under electrical stimulation (n = 5 mice). f Representative images of upper limb movement by single-site optogenetic stimulation (SS) (81.6 mW, 20 msec-on/2 sec-off). Joint angle movement of shoulder, elbow, wrist, knuckle in single-site optogenentic stimulation (middle right) and MOSD stimulation (right). Extension was defined as positive angle; flexion was defined as negative angle (n = 3 mice). Data are presented as mean ± s.e.m. Scale bar is 200 µm (b)

