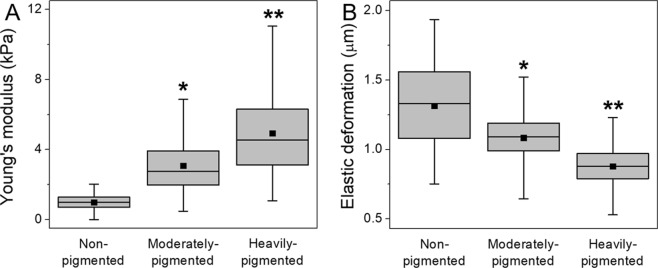
Figure 2.
Nanomechanical properties of melanoma cells used in this study. Box plots of the Young’s modulus values (A) and of maximum elastic deformation (B) for melanoma cells with different levels of melanin pigmentation and for non-pigmented melanoma cells. Square dots in box plots indicate the median values, whereas horizontal lines represent means. *Statistically significant vs. non-pigmented cells; **statistically significant vs. moderately-pigmented cells. For all values P < 0.0001.

