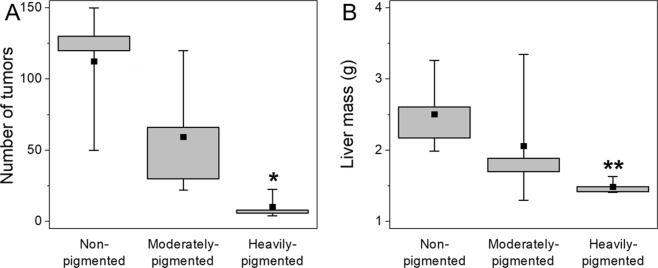
Figure 3.
Results obtained from in vivo experiments. Box plots of liver masses (A) taken from mice, which had inoculated melanoma cells with different levels of melanin pigmentation followed by box plot of the number of metastatic tumors (B) that were visible on the livers during autopsy. Square dots in box plots indicate the median values. *Statistically significant vs. non-pigmented cells (P < 0.05); **statistically significant vs. non-pigmented cells (P < 0.01).

