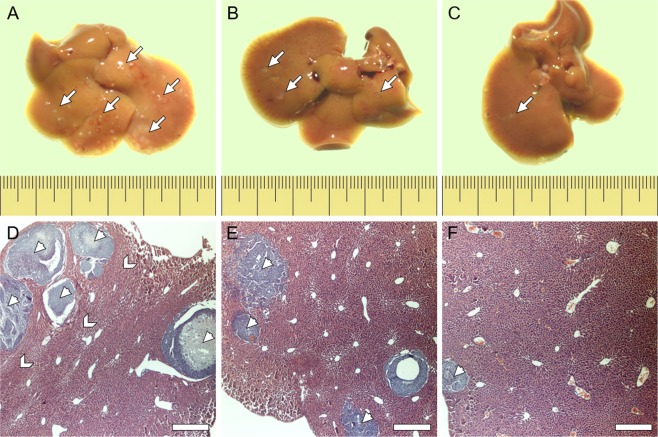
Figure 4.
Tissue samples with metastatic tumors isolated from mice. Liver samples isolated from mice, which had inoculated melanoma cells with different levels of melanin pigmentation: non-pigmented (A,D), moderately-pigmented (B,E) and heavily-pigmented (C,F). Upper row images show entire livers, whereas lower row images show histological samples of the livers. Arrows in the upper row images indicate the locations of metastatic colonies, whereas arrow heads in the lower row images indicate individual tumors. Note the morphology of the lobules of livers in the case of mice inoculated with non-pigmented melanoma cells is much more compact than in the case of mice inoculated with pigmented cells, indicating higher tissue density. Higher tissue compaction is indicated by chevrons. Scale pitch on the rulers represents one millimeter, whereas scale bars represent 200 μm.

