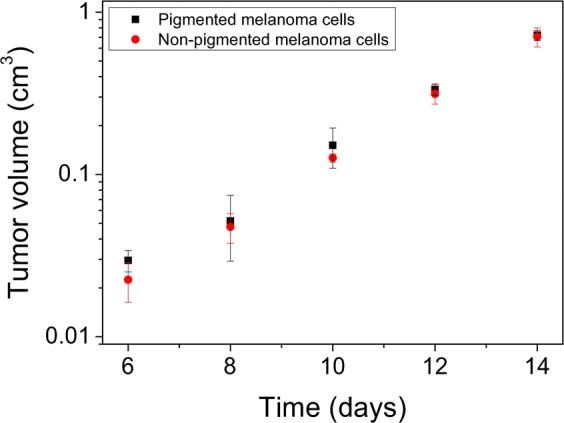
Figure 6.

Growth curves of tumor progression for pigmented and non-pigmented SKMEL-188 cells in nude mice. Tumor volume (y axis) is plotted in logarithmic scale. To determine the volume of the tumors, the oblate spheroid approximation was used. In calculation of the spheroids volume, the two horizontal axes were averaged giving the equatorial diameter of a spheroid, whereas tumor height indicated half of the spheroid’s polar diameter.
