Fig. 3.
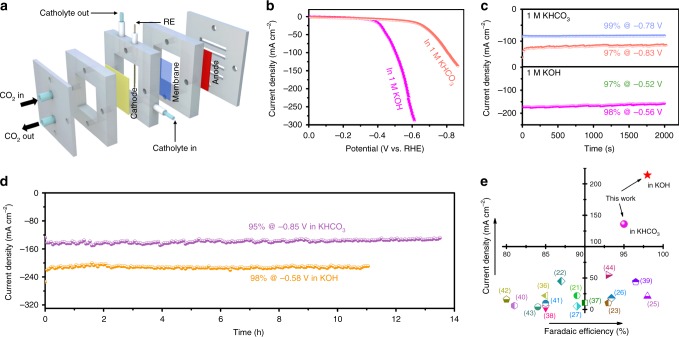
Electrochemical carbon dioxide reduction measurements in the flow cell. a Schematic illustration of the flow cell configuration. b Polarization curves of nanotube-derived Bi (NTD-Bi) in 1 M KHCO3 or 1 M KOH. c Chronoamperometric responses at a few different potentials in the two electrolytes. d Long-term amperometric stability in the two electrolytes. e Comparison of our results with previous data in terms of current density and Faradaic efficiency; corresponding reference numbers are included in brackets

