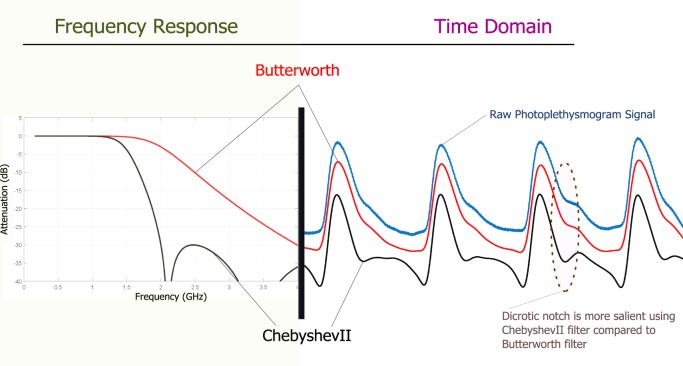
Fig. 3.
Filter impact on PPG morphology. The left figure shows the impulse response difference between the Butterworth (red line) and ChebyshevII (black line) filters. The right figure shows the Butterworth bandpass filtered (red line) and the ChebyshevII bandpass (black line) filtered PPG signals of the raw PPG signal (blue line). It is clear that the ChebyshevII filter is able to emphasize the difference between the systolic and diastolic waves, compared to the Butterworth filter.6 PPG photoplethysmogram, dB Decibel, GHz Gigahertz

