Fig. 3.
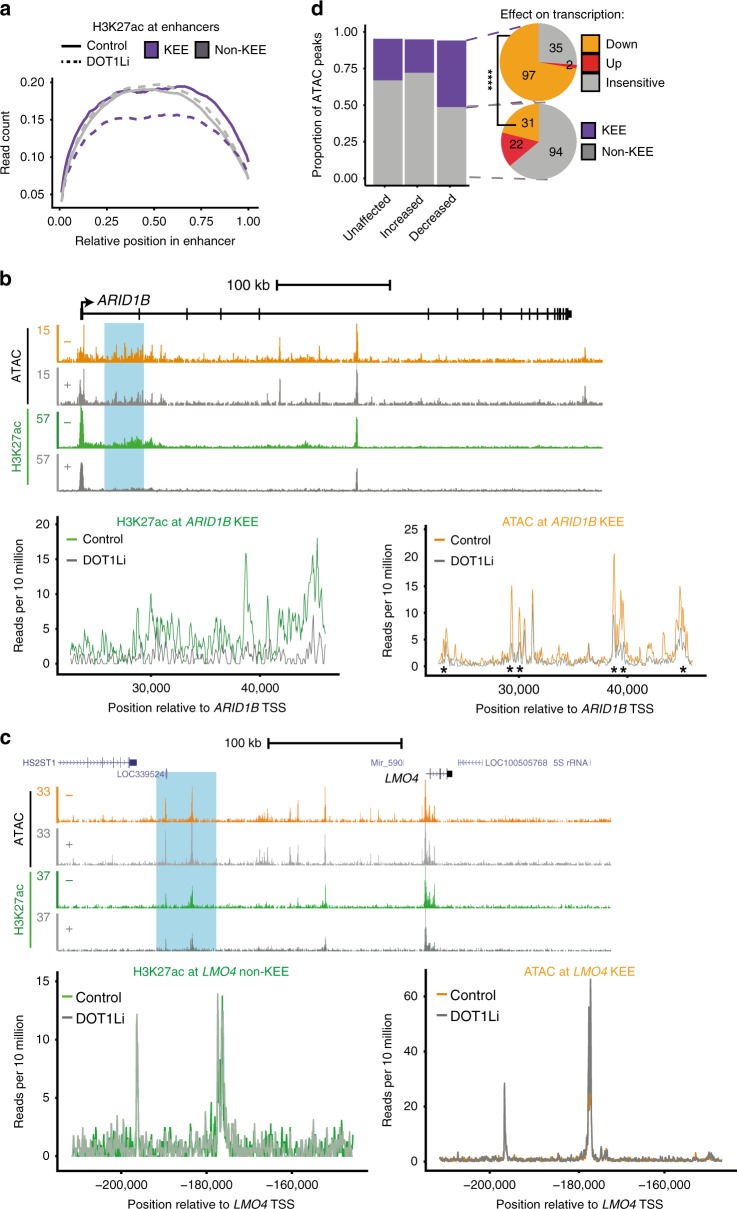
Loss of H3 lysine 79 methylation 2/3 (H3K79me2/3) leads to reduction in H3 lysine 27 acetylation (H3K27ac) and chromatin accessibility at H3K79me2/3 Enhancer Elements (KEEs). a Metaplot of H3K27ac chromatin immunoprecipitation-sequencing (ChIP-seq) signal across KEEs (purple) or non-KEEs (gray) in control (solid line) and DOT1Li (dashed line) SEM cells, n = 1. b, c Upper: assay for transposase-accessible chromatin using sequencing (ATAC-seq) and H3K27ac ChIP-seq at ARID1B and LMO4 in control (−, orange/green) and DOT1Li (+, gray) SEM cells. Blue boxes highlight KEE cluster 1 region of ARID1B and non-KEE region associated with LMO4. Lower: Overlay of H3K27ac (left) and ATAC (right) signal at ARID1B KEE1 and LMO4 non-KEE in control (green/orange) and DOT1Li (gray). Asterisks represent significant decreases in ATAC signal following DOT1Li, false discovery rate (FDR) < 0.05. d Left: Proportion of increased, decreased, or unchanged ATAC peaks found within a KEE (purple) or non-KEE (gray). Right: Proportion of decreased ATAC peaks within a KEE (upper) or non-KEE (lower) that are associated with transcriptionally downregulated (orange), upregulated (red), or insensitive (gray) gene. ****P < 0.0001, Fisher’s exact test, n = 5. See also Supplementary Fig. 3

