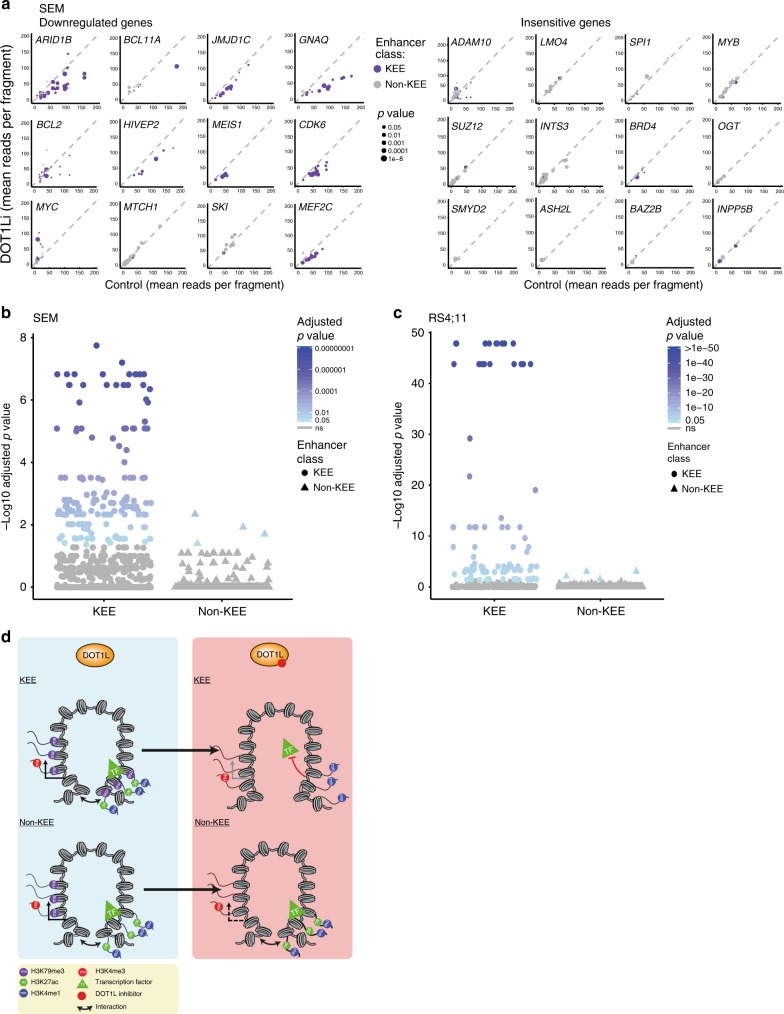
Fig. 6.
Loss of H3 lysine 79 methylation 2/3 (H3K79me2/3) leads to widespread reductions in H3K79me2/3 Enhancer Element (KEE)–promoter interactions. a Enhancer–promoter Capture-C interaction frequencies in Control (x-axis) and DOT1Li (y-axis) SEM cells. Left: Interactions with DOT1Li-downregulated genes; right: DOT1Li-insensitive genes. Each point represents the interaction of a KEE (purple) or non-KEE (gray) with the indicated gene promoter. Size of dot corresponds to significance of change in interaction, using a Wilcoxon’s rank test. See Supplementary Table 1 for list of p values. b, c Statistical analysis of the significance of the change in enhancer–promoter Capture-C interactions following DOT1Li in SEM and RS4;11 cells. Each point represents the interaction of a KEE (circle) or non-KEE (triangle) with a gene promoter. Holm–Bonferroni adjusted p values were calculated following a Wilcoxon’s rank test (n = 3). d Model for the role of H3K79me2/3 at KEEs. Loss of H3K79me2/3 at KEEs following DOT1Li leads to a reduction in H3K27ac, transcription factor (TF) binding and enhancer–promoter interactions. This is associated with a reduction in gene expression of the KEE-associated gene. Loss of H3K79me2/3 within the gene body leads to no changes in non-KEE enhancer activity or enhancer–promoter interaction. A reduction in transcription of the non-KEE gene may be observed due to enhancer-independent roles of H3K79me2/3 in the gene body. See also Supplementary Fig. 6

