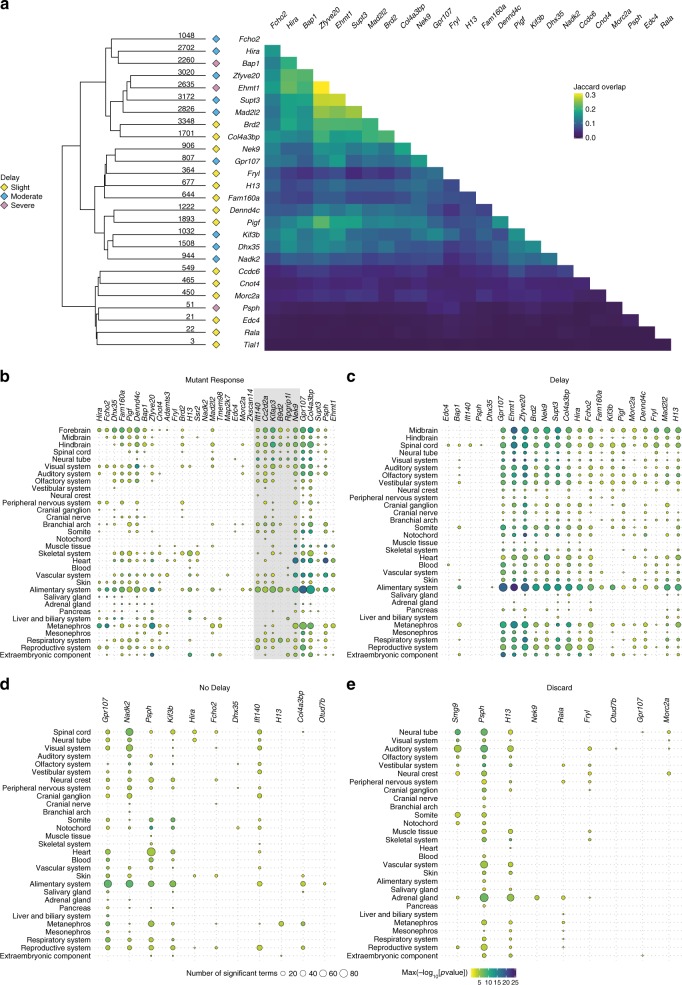
Fig. 3.
Anatomical term enrichment analysis. a Pairwise overlaps between Delay gene lists. The heatmap on the right shows the Jaccard similarity index (number in both lists/number in either list) for pairs of delayed mutant lines. The heatmap has been hierarchically clustered and the tree is displayed on the left along with the number of genes in each Delay gene list. The category of delay for each line is indicated by coloured diamonds (yellow = Slight, blue = Moderate, purple = Severe). b–e Bubble plots of the enriched Edinburgh Mouse Atlas Project Anatomy (EMAPA) terms produced from the four categories of differentially expressed genes. The mutant lines are displayed on the x-axis and the terms are on the y-axis. The ordering of mutants on the x-axis was determined by hierarchical clustering of the overlap (Jaccard Index) of terms between lines. The enriched terms on the y-axis were simplified by aggregating to terms at the top of the EMAPA ontology graph. The size of the bubbles represents the number of terms that have been simplified to the higher-level term and they are coloured by maximum −log10[p value]. Mutant lines with no enrichments have been excluded from the plots. b Mutant Response. Small groups of lines have similar tissues enriched. The grey box highlights the ciliopathy lines that cluster together based on similarity of enriched EMAPA terms. c Delay. The enriched tissues are more uniform across the lines. d No Delay. e Discard. For No Delay and Discard fewer lines have enriched terms and there is little pattern to the enriched tissues

