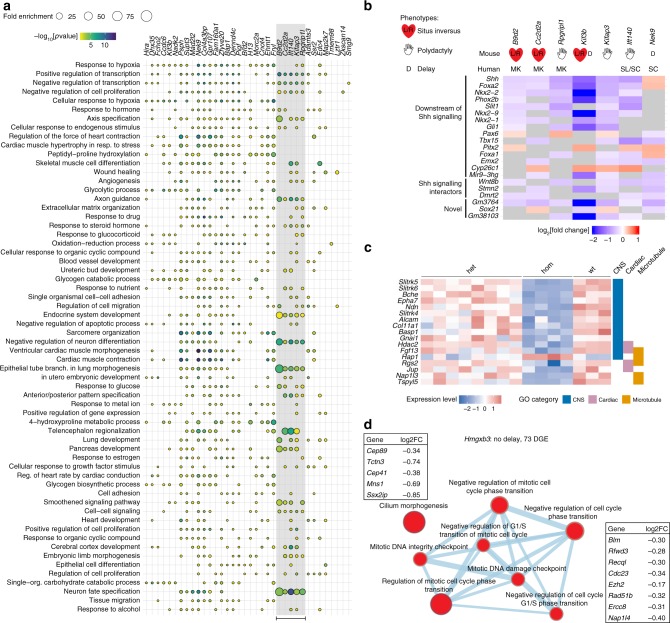
Fig. 5.
Mutant response overview and examples. a Bubble plot of the enriched Gene Ontology (GO) terms shared across most mutant lines, with lines on the x-axis and GO terms on the y-axis. The ordering of mutants on the x-axis was determined by hierarchical clustering of the overlap (Jaccard Index) of terms between lines. The size of the bubbles represents fold enrichment (Observed Genes/Expected) and they are coloured by −log10[p value]. The group of ciliopathy mutants are highlighted with a grey box and a bar at the bottom. b Heatmap of the log2[fold change] of genes that are differentially expressed (DE) in at least four of the seven mutants identified as having similar ciliopathy profiles. Mutant lines are shown on the x-axis and DE genes on the y-axis. Phenotypes associated with mutations in human and mouse are shown above the heatmap. The DE genes have been categorised into three groups, Downstream of Shh signalling, Shh signalling interactors and Novel. c Heatmap of 17 DE genes from the Zkscan17 mutant line associated with central nervous system (CNS), cardiac or microtubule GO terms. The heatmap displays expression values as mean centred and scaled normalised counts in all samples and the GO categories associated with each gene are shown to the right of the heatmap. d Network diagram produced by Enrichment Map (Cytoscape App) of the GO term enrichment in the Hmgxb3 mutant line. The nodes represent enriched GO terms and the edge widths are proportional to the overlap of genes annotated to each term. Not all enriched GO terms are included. Source data are provided as a Source Data file

