Fig. 6.
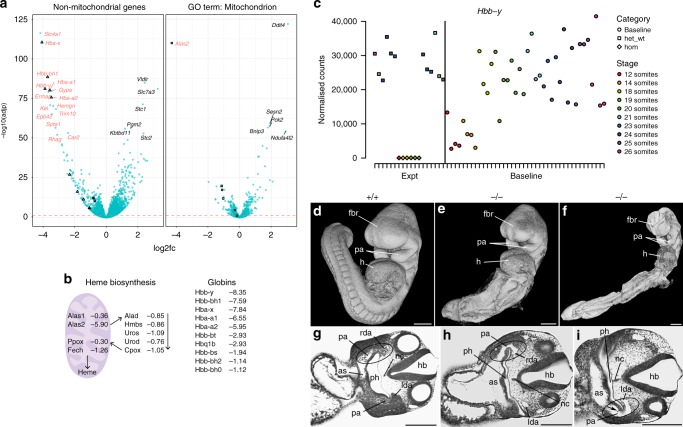
Phenotype of the Nadk2 line. a Volcano plots of genes in the Nadk2 mutant line. log2[fold change] is plotted on the x-axis and −log10[p value] on the y-axis. Genes associated with Gene Ontology term GO:0005739 (mitochondrion) are shown on the right and those not associated are on the left. Squares indicate genes from the heme biosynthesis pathway and triangles are haemoglobin genes. Gene names in red are associated with erythrocyte development. b Genes involved in the heme pathway on the left and haemoglobins on the right, plus their log2[fold change] in the Mutant Response. Genes whose products are localised to mitochondria are shown inside the purple oval. c Example count plot for Hbb-y, containing samples from the mutant line as well as somite stage-matched baseline samples. Homozygous embryos are shown as diamonds, siblings (heterozygous and wild-types) are squares and baseline samples are represented by circles. Points are coloured according to stage. d–i High-resolution episcopic microscopy data for the Nadk2 line. d–f 3D models of the embryo surface. d Wild-type embryo (+/+). e, f Homozygous mutant embryos (−/−); e is mainly delayed in its caudal body parts, whereas f is globally delayed. fbr forebrain, h heart, pa pharyngeal arch. g–i Corresponding axial sections from the embryos in (d–f) at the level of the heart. as aortic sac, pa pharyngeal arch artery, lda left dorsal aorta, rda right dorsal aorta, ph pharynx, hb hindbrain (respectively fourth ventricle), nc notochord. The control embryo (g) has a large number of clearly visible blood cells in the aortic sac and arteries, whereas the homozygotes have no, h (4 of 6), or very few, i (2 of 6), erythrocytes (arrow). Compare circled areas in (g, h and i). Scale bars are 250 µm. Source data are provided as a Source Data file

