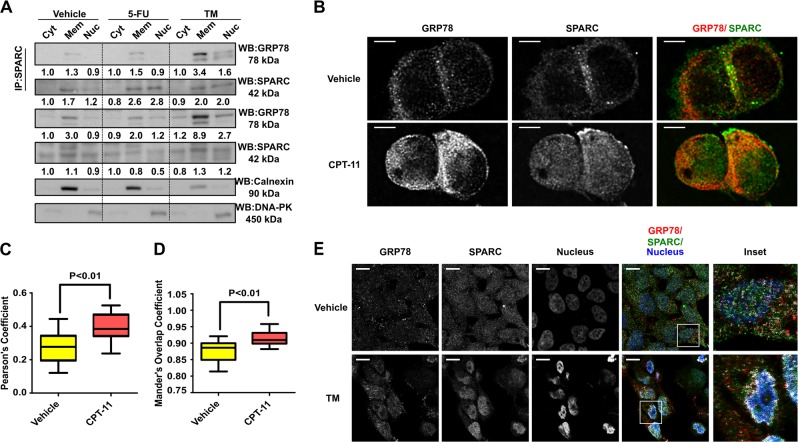
Fig. 2. Dynamic interaction between SPARC and GRP78 in the ER occurs with chemotherapy-induced ER stress.
(a) HCT116 were treated with 5-FU (25 μM, 12 h) and TM (1 μg/ml, 6 h) followed by cell fractionation, co-IP and Western blot analysis of cytoplasmic (Cyt), membranous (Mem), and nuclear (Nuc) fractions. Calnexin and DNA-PK served as quality control of cell fractionation. Densitometry quantification was performed, and the densitometry values were indicated below the blots. (b) Immunofluorescent analysis of HCT116 cells treated with CPT-11 (50 μM, 12 h) or vehicle by confocal microscopy. Cells were labeled with primary antibodies against SPARC (green) and GRP78 (red). Quantitative colocalization analysis was performed followed by deconvolution of the images. Scale bar = 5 μm. (c) The Pearson’s coefficient and (d) the overlap coefficient was calculated from 12 images (N = 12) for each group. (e) Immunofluorescent analysis of MIP/SP cells treated with TM (1 μg/ml, 6 h) or vehicle. Colocalization of GRP78 and SPARC was evident in TM-treated cells based on the analysis using the ImageJ Colocalization Finder plugin (white). Fluorescence intensities were gamma-corrected (gamma = 2.0) to reveal the colocalization pixels in the perinuclear region. Scale bar = 10 μm

