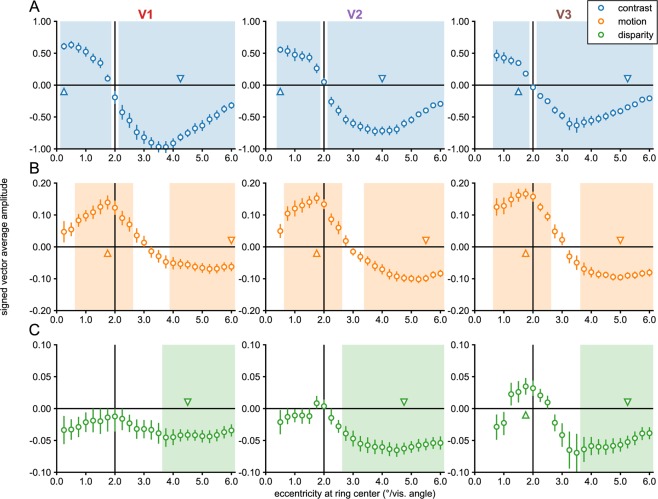
Figure 2.
Eccentricity analysis of V1-V3 in Experiment 1. Signed vector-average amplitudes for the contrast (A), motion (B) and disparity (C) conditions within 24 sub-ROIs, defined based on a retinotopy template as centered on eccentricities spaced 0.25° apart, each having a width of 0.5°, as plotted on the x-axes. Note that V2 and V3 sub-ROIs centered at low eccentricities (0.25° for V2; 0.25° and 0.5° for V3) were not analyzed and plotted (see Methods). The shaded areas on the plots indicate condition × sub-ROI combinations that were significant at α = 0.05. The positively and negatively signed sub-ROIs that had the lowest p-values for each combination have been indicated with up and down-arrows, and single cycle averages have been plotted for these sub-ROIs in Fig. 3. For disparity, no V1 sub-ROIs were given a positive sign, and the two positively signed sub-ROIs in V2 were far from significance, so the positively signed cycle average for disparity was only plotted for V3, where the lowest positively signed p-value was close to significance (p = 0.06). The real and imaginary values used to compute the signed vector-average amplitudes have been plotted for the highlighted negatively and positively signed V3 sub-ROIs in Supplementary Fig. 1. The color of the text for the ROI names matches the ROI colors plotted on the inflated cortical surface reconstruction in Fig. 6.

