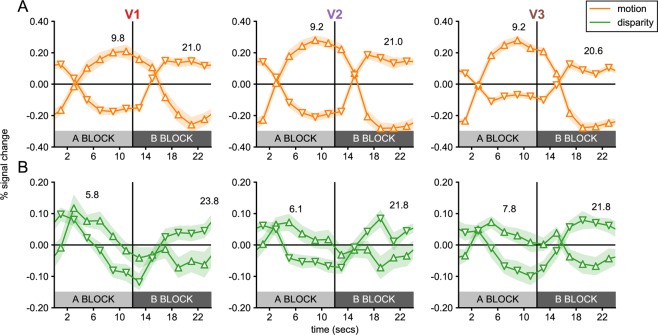
Figure 5.
Single cycle averages for V1, V2 and V3 sub-ROIs in Experiment 2. Single cycle averages computed for the most significant positively and negatively signed sub-ROIs in each visual cortex ROI, following the color and marker convention of Fig. 2. The shaded region around each plot indicates the standard error of the mean, across participants. The delay of the peak response, estimated based on the phase, is plotted above each cycle average. Note that cycle averages have been plotted at the middle of each 2-second TR. The plot clearly demonstrates that positively-signed sub-ROIs (up-arrows) respond preferentially to the A block, while negatively signed ROIs respond preferentially to the B block (down-arrows).

