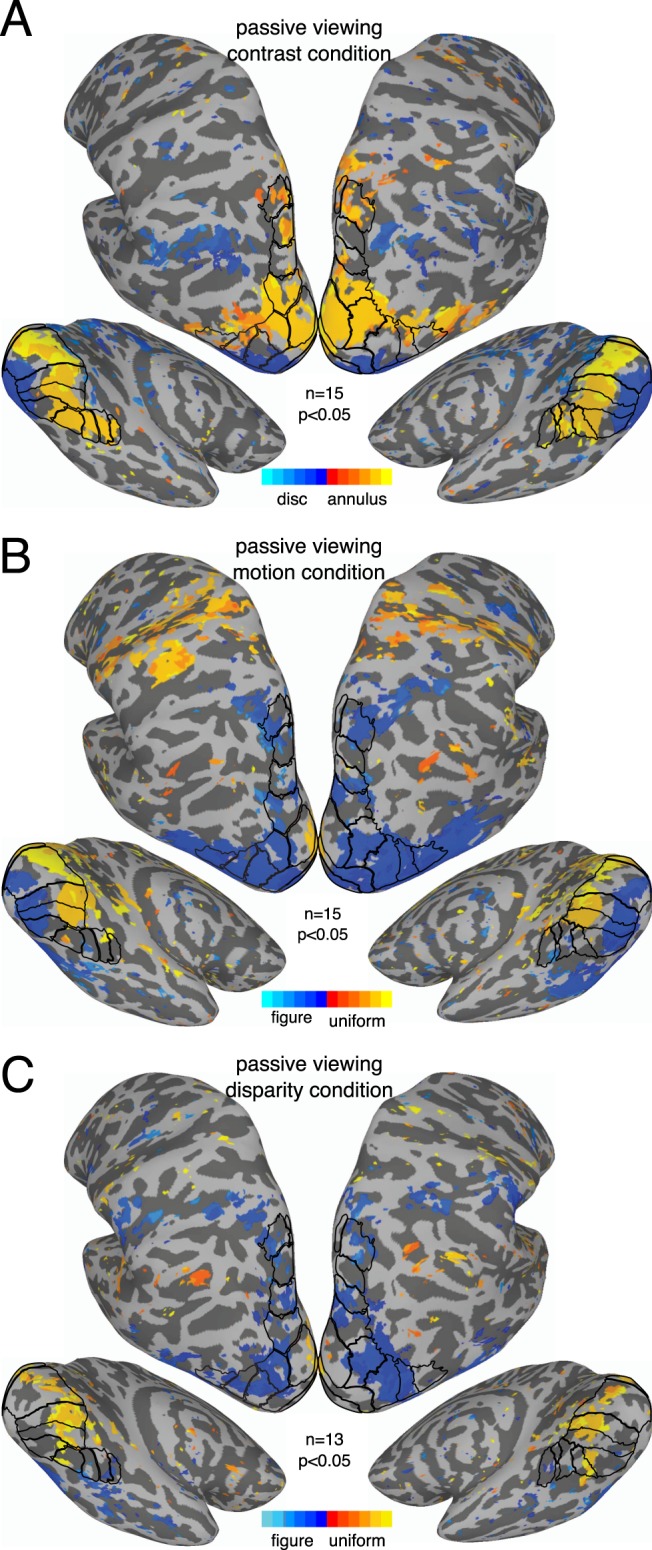
Figure 7.

Whole-brain results from Experiment 1. Vector-averaged phase maps, converted to seconds of delay, thresholded at α = 0.05. Maps were produced through surface-based alignment procedure in which each subjects’ cortical mesh was converted to a standardized mesh, which allowed for cross-subject comparisons of values at each mesh node. The vector-average phase across subjects, as well as a corresponding p-value based on both amplitude and phase, could then be computed for each mesh node. As indicated by the color bar, orange shades indicate responses to the A block, while blue shades indicate responses to the B block. The ROIs are outlined on the surface, and labeled versions can be inspected in Fig. 6.
