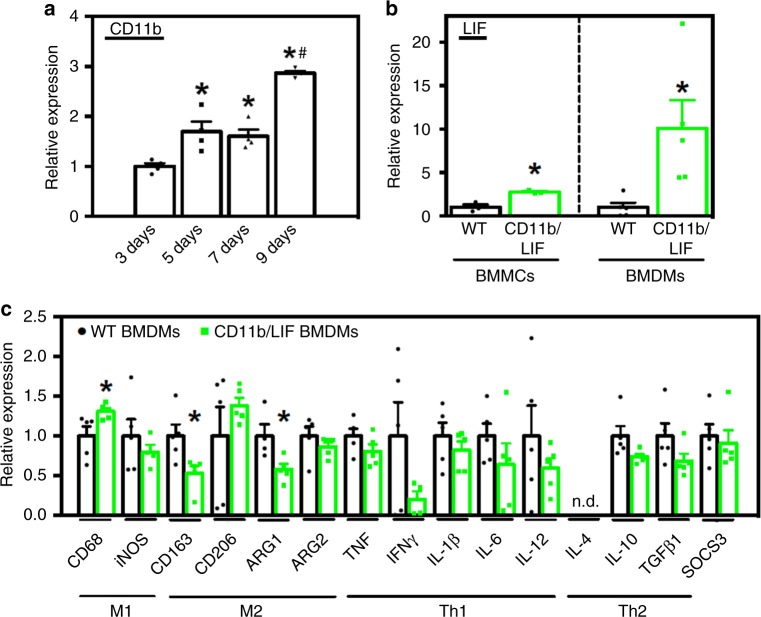
Fig. 1.
Differentiation of BMCs into macrophages increases CD11b/LIF transgene expression, causing suppression of M2-biased macrophage markers. a QPCR data showing differences in the level of Cd11b expression in C57BL6 BMCs stimulated with MCSF and differentiated to macrophages for 3–9 days. Values are normalized to 3-day cultures, n = 4 for each data set; * indicates significantly different from 3-day data set and # indicates significantly different from 5- and 7-day data sets at P < 0.05. P-values based on ANOVA with Tukey’s multiple comparison test. For all histograms in the figure, the bars indicate mean ± sem. b QPCR data showing increased Lif expression in freshly-isolated BMMCs and BMDMs cultured for 9 days from CD11b/LIF transgenic mice compared to transgene negative littermate controls (WT). Data are presented as mean ± sem. BMCs were isolated from three independent donors, n = 3 per data set. * Indicates significantly different from WT at P < 0.05. P-values based on two-tailed t-test. F-test BMDMs day 9 (P = 0.0038). c QPCR analysis shows that CD11b/LIF BMDMs have increased the expression of Cd68 and reduced the expression of Cd163 and Arg1. Data are presented as mean ± sem, n = 5 for each data set, n = 4 for WT BMDMs Inos, and CD11b/LIF BMDMs Arg1 data sets (P < 0.05). n.d. indicates that no expression was detected. Data presented for BMDMs (b, c) were isolated from a single donor animal of each genotype and cultured as n = 5 technical replicates. Significant findings were verified with biological replicates of experiments from independent donors. * Indicates significantly different from WT BMDMs at P < 0.05. P-values based on two-tailed t-test. F-test Cd206 (P = 0.0258) and Il10 (P = 0.0311). Source data are provided as a Source Data file

